Skip to content
Services
Appraisals
Consulting
Resources
Market Reports
Charts
Matrix Blog
Articles & Research
Press
About
get in touch
Charts
› Queens
April 11, 2024
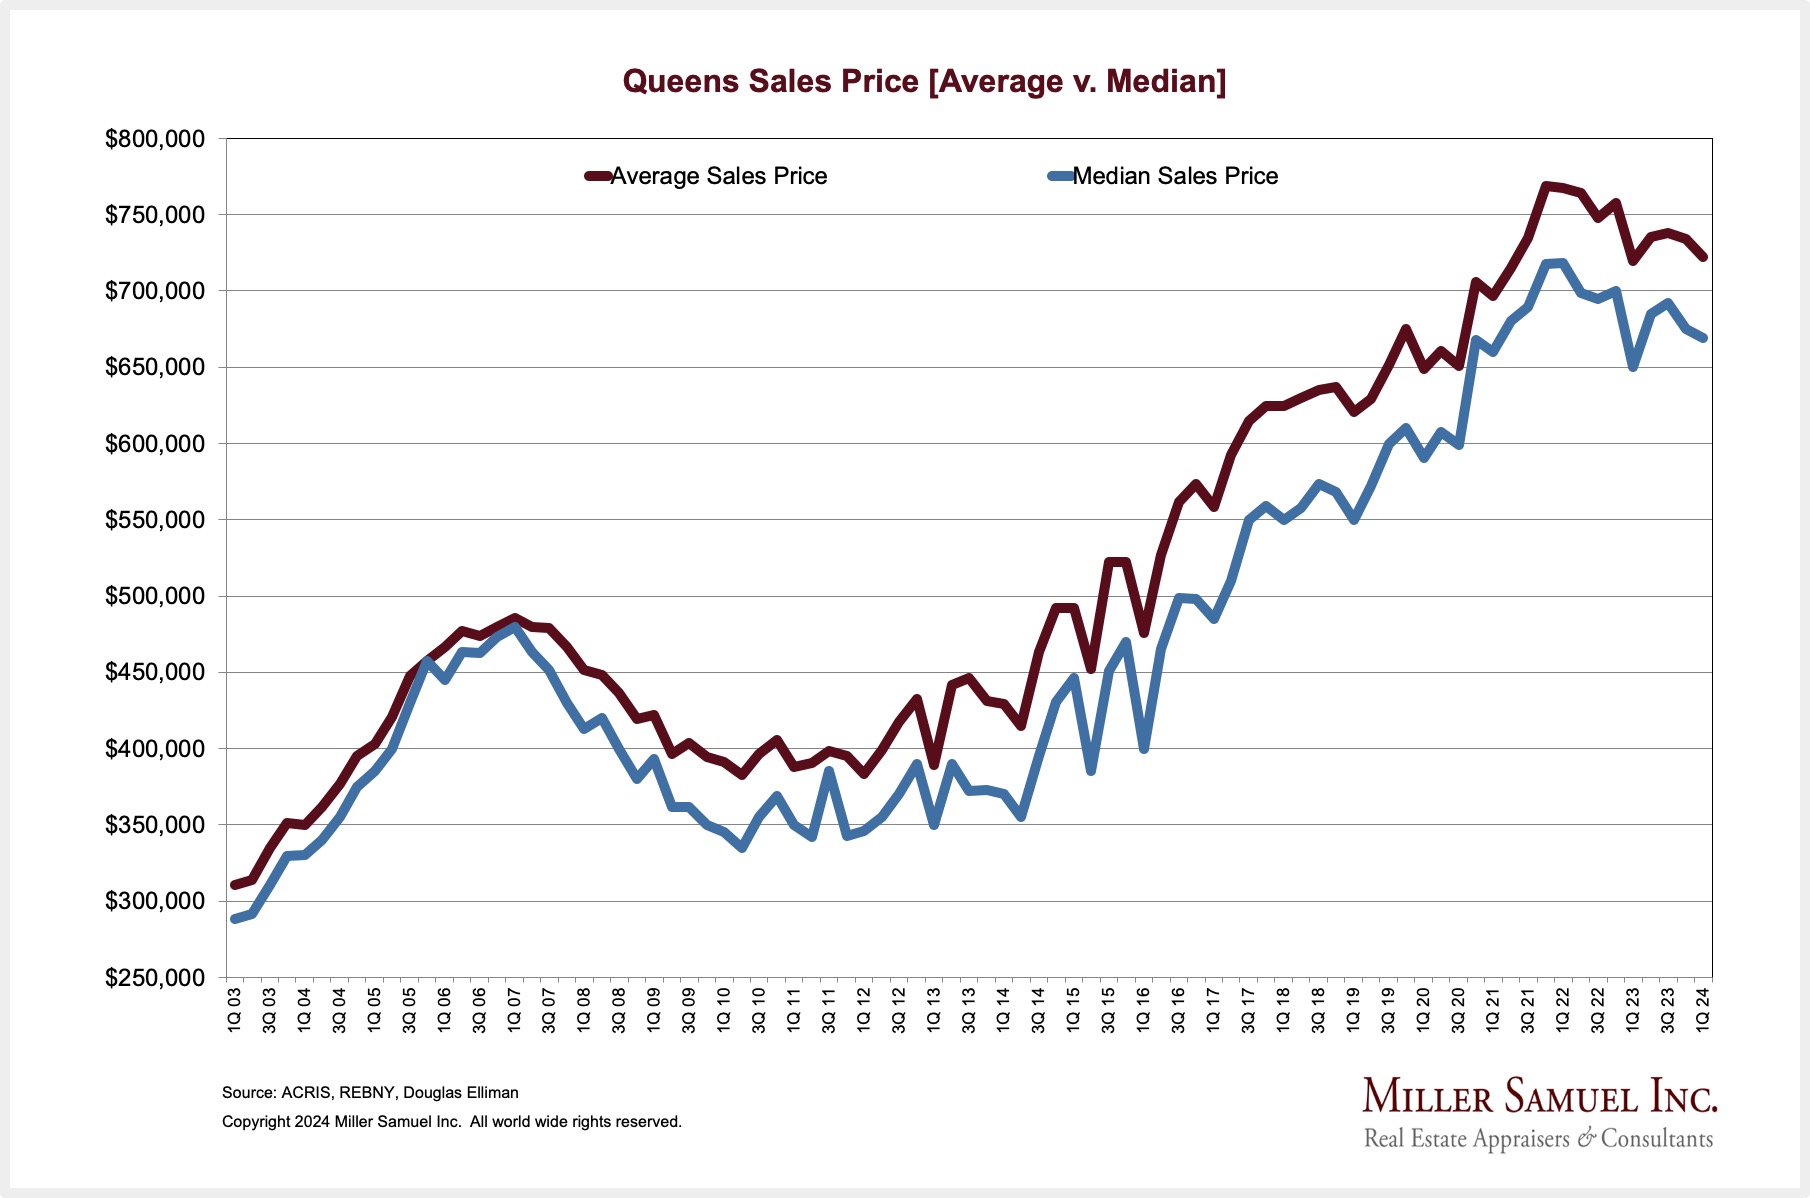
Queens Sales Price [Average v. Median]
read more
April 11, 2024
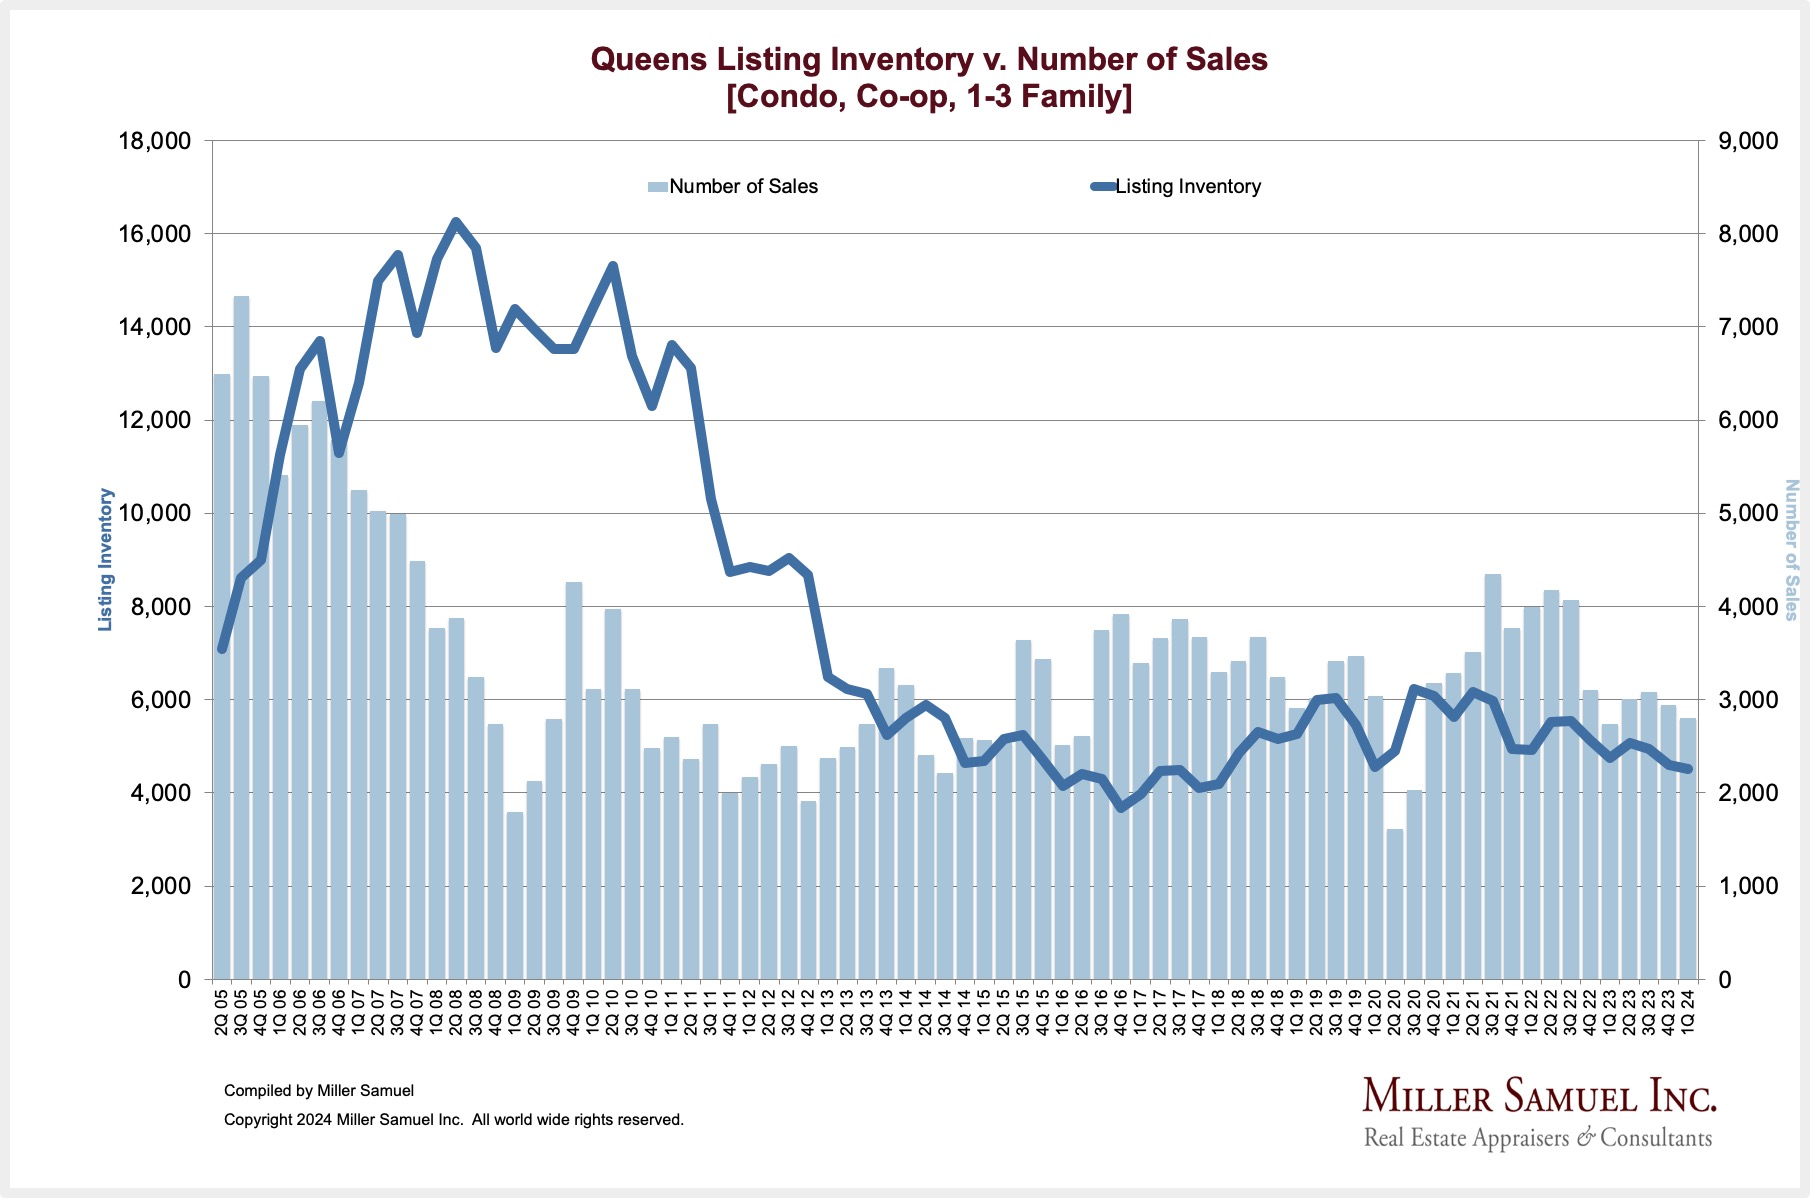
Queens Listing Inventory v. Number of Sales [Condo, Co-op, 1-3 Family]
read more
April 11, 2024
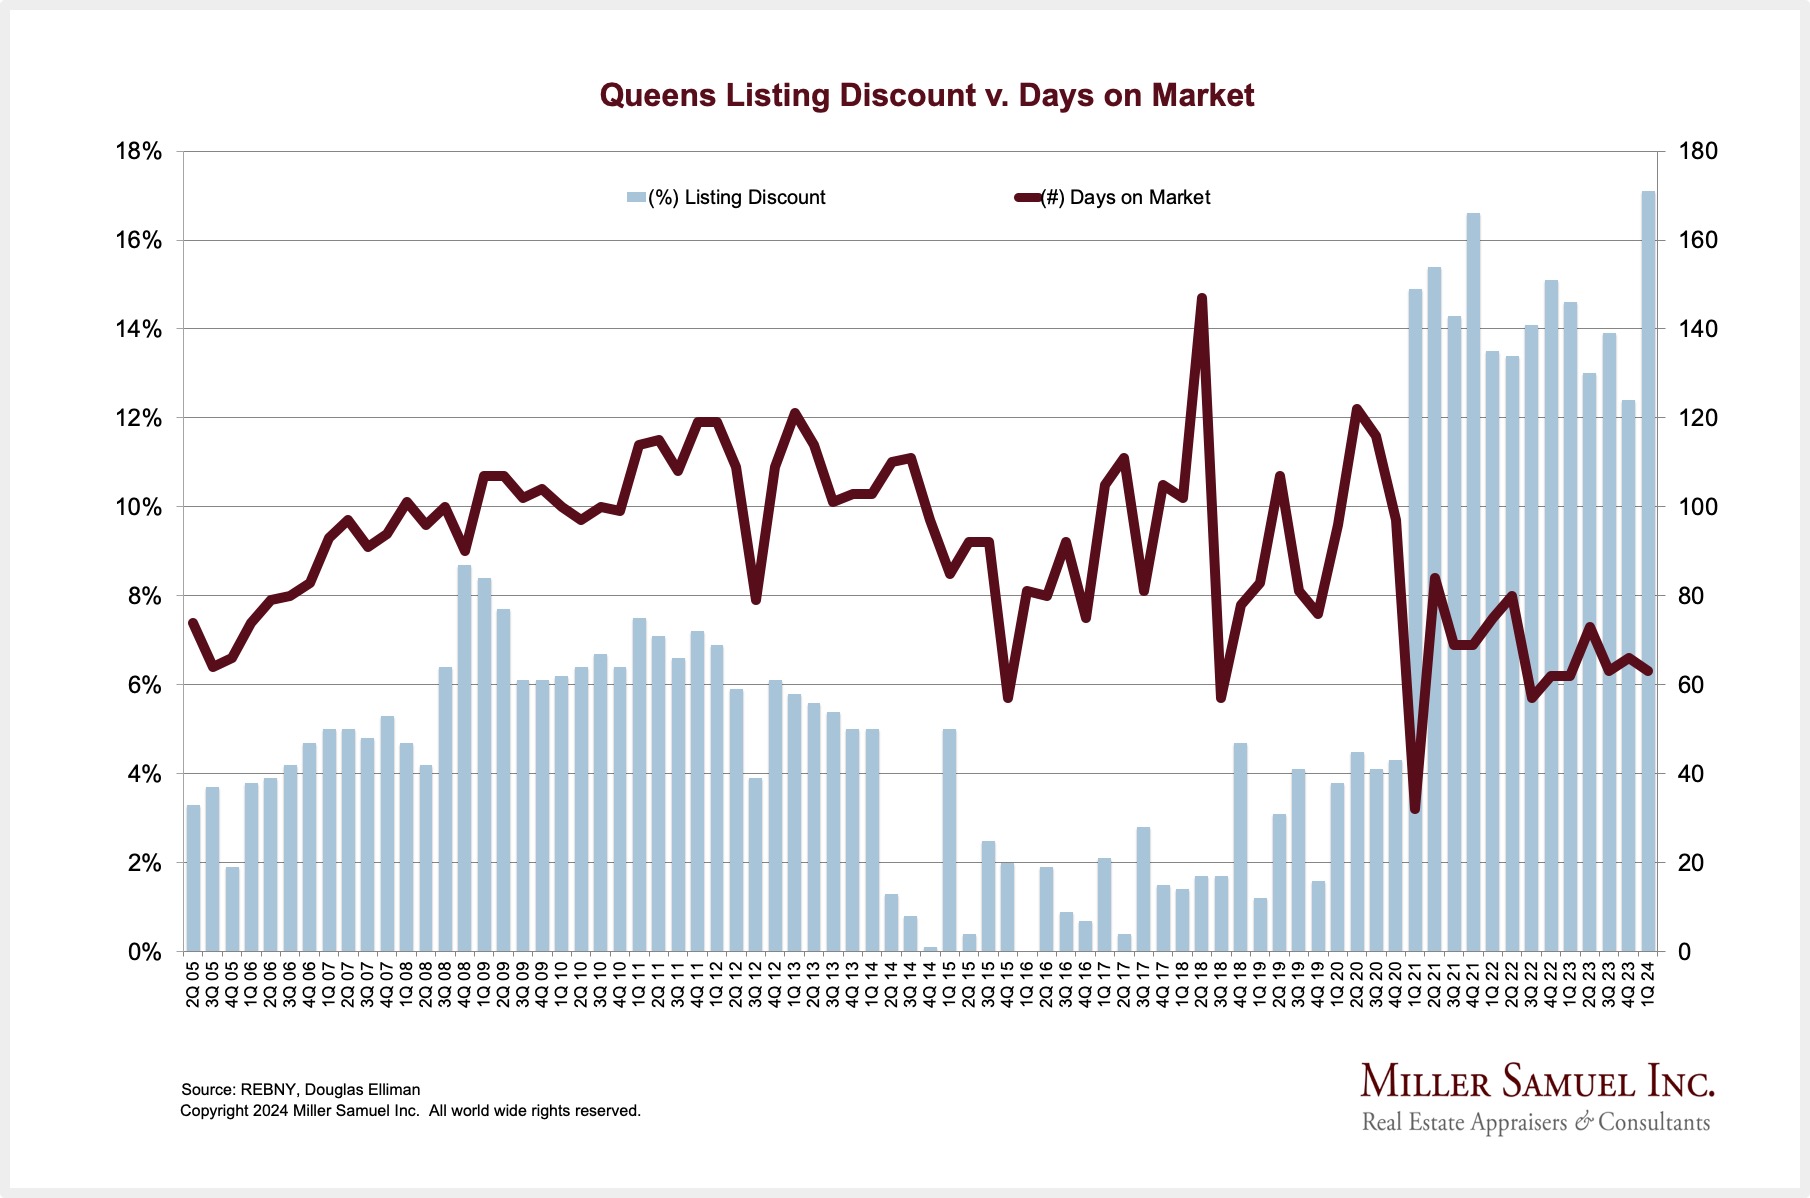
Queens Listing Discount v. Days on Market
read more
April 11, 2024
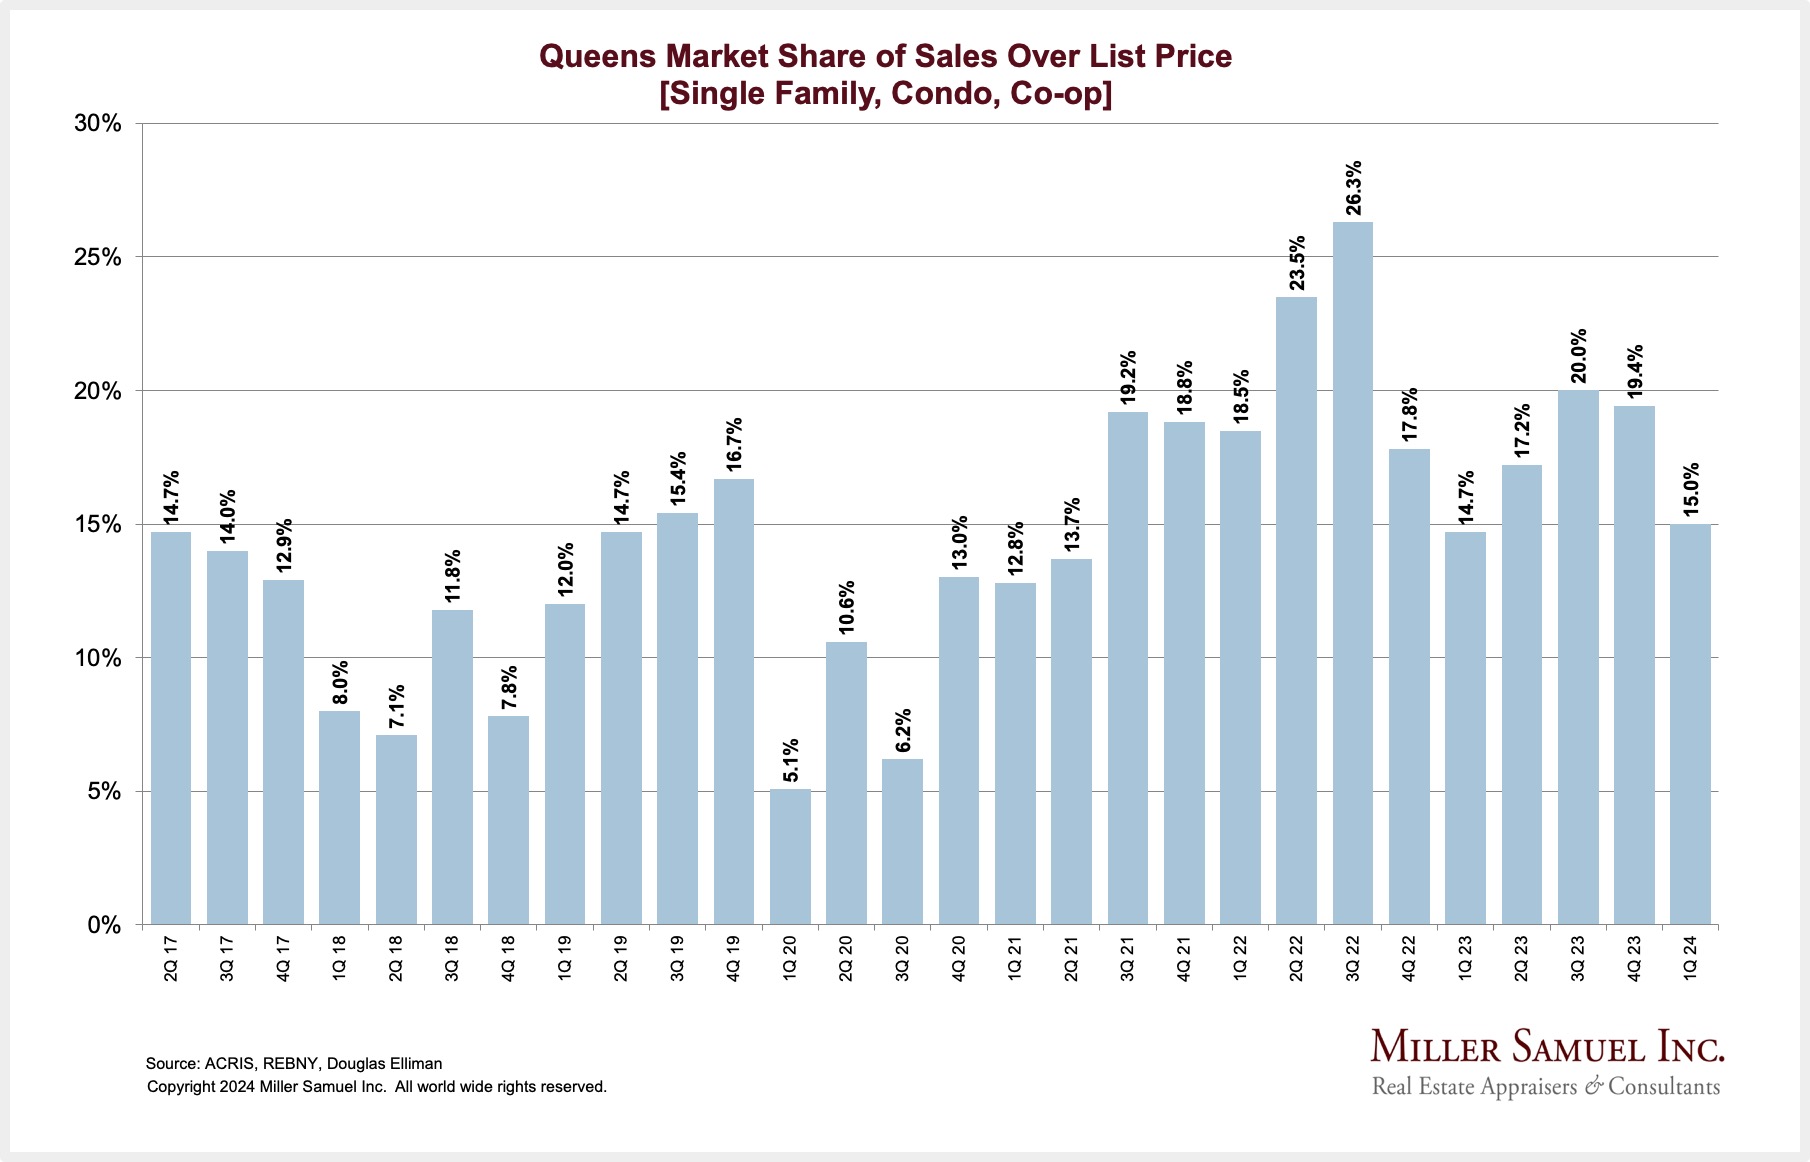
Queens Market Share of Sales Over List Price [1-3 Family, Co-op, Condo]
read more
April 11, 2024
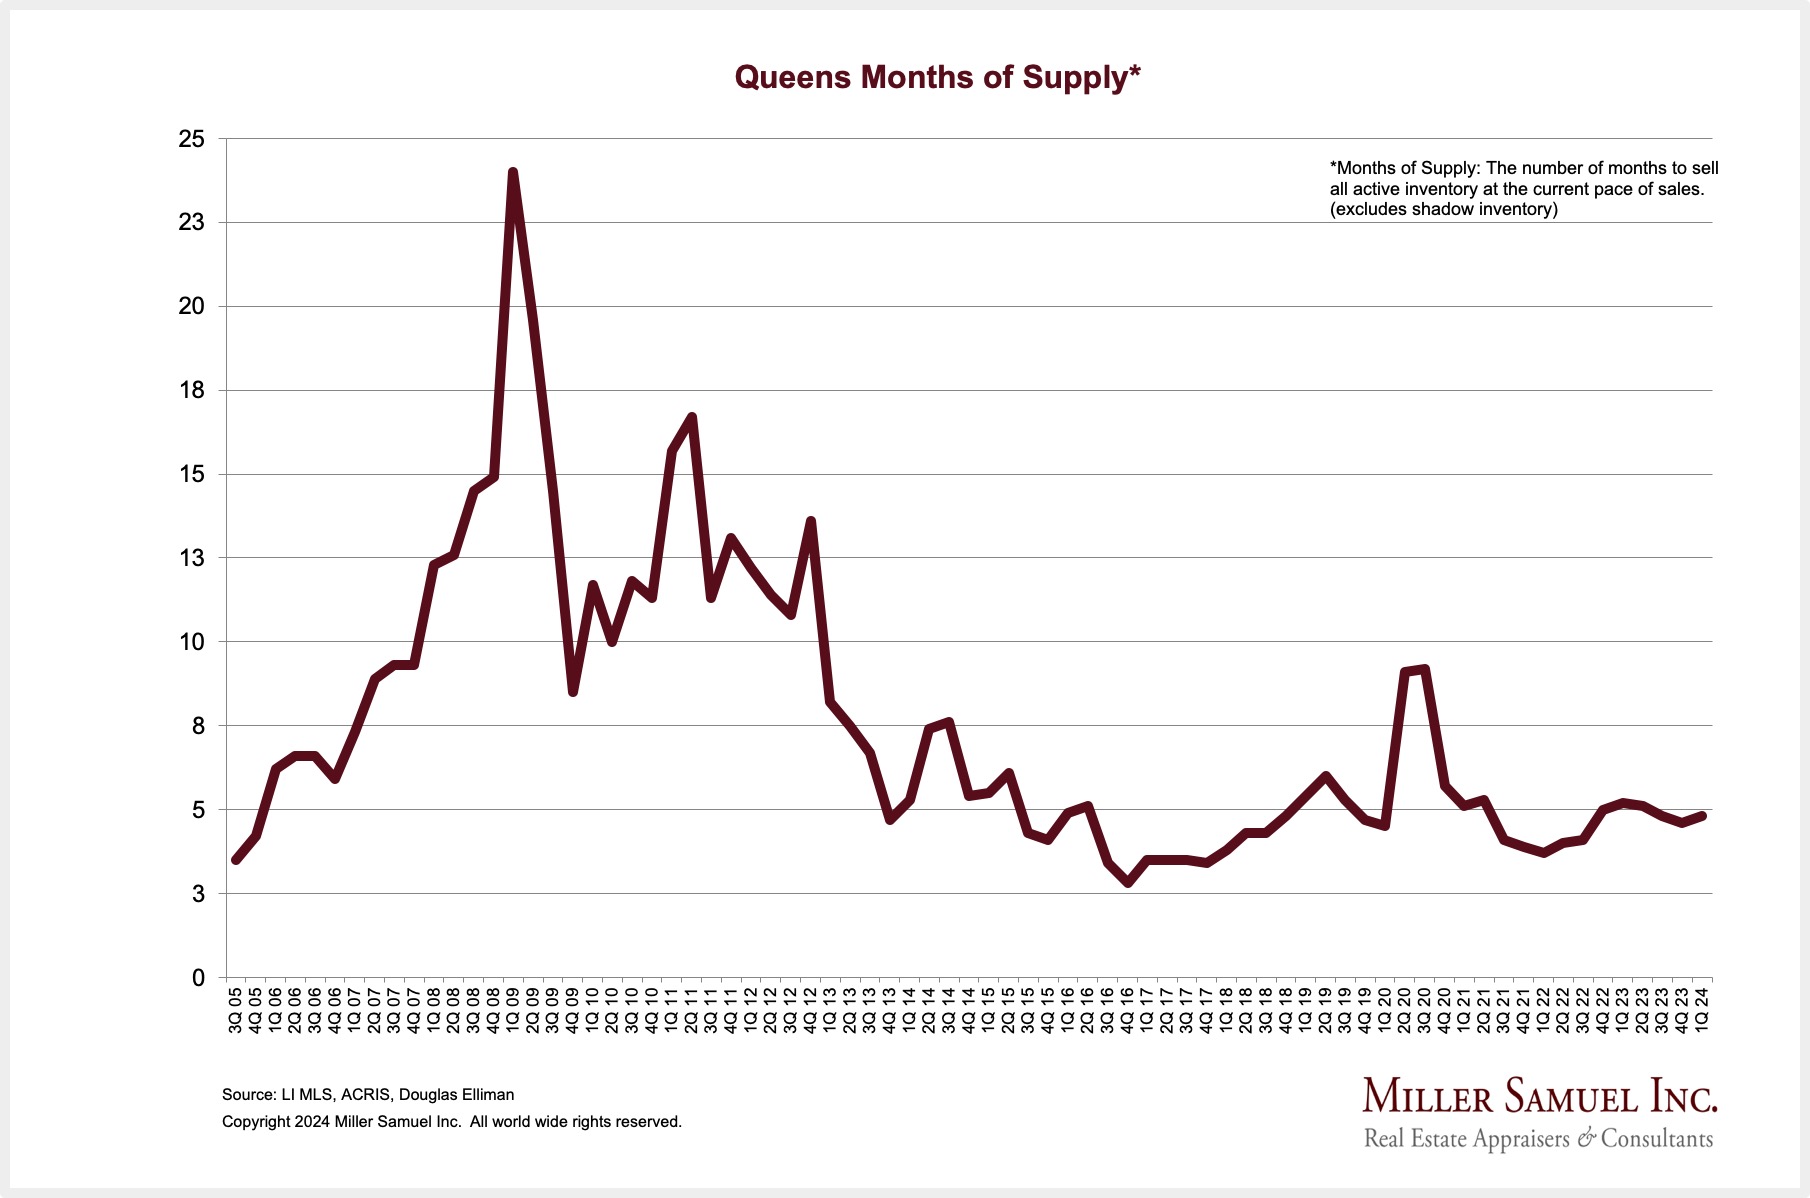
Queens Months of Supply*
read more
April 11, 2024
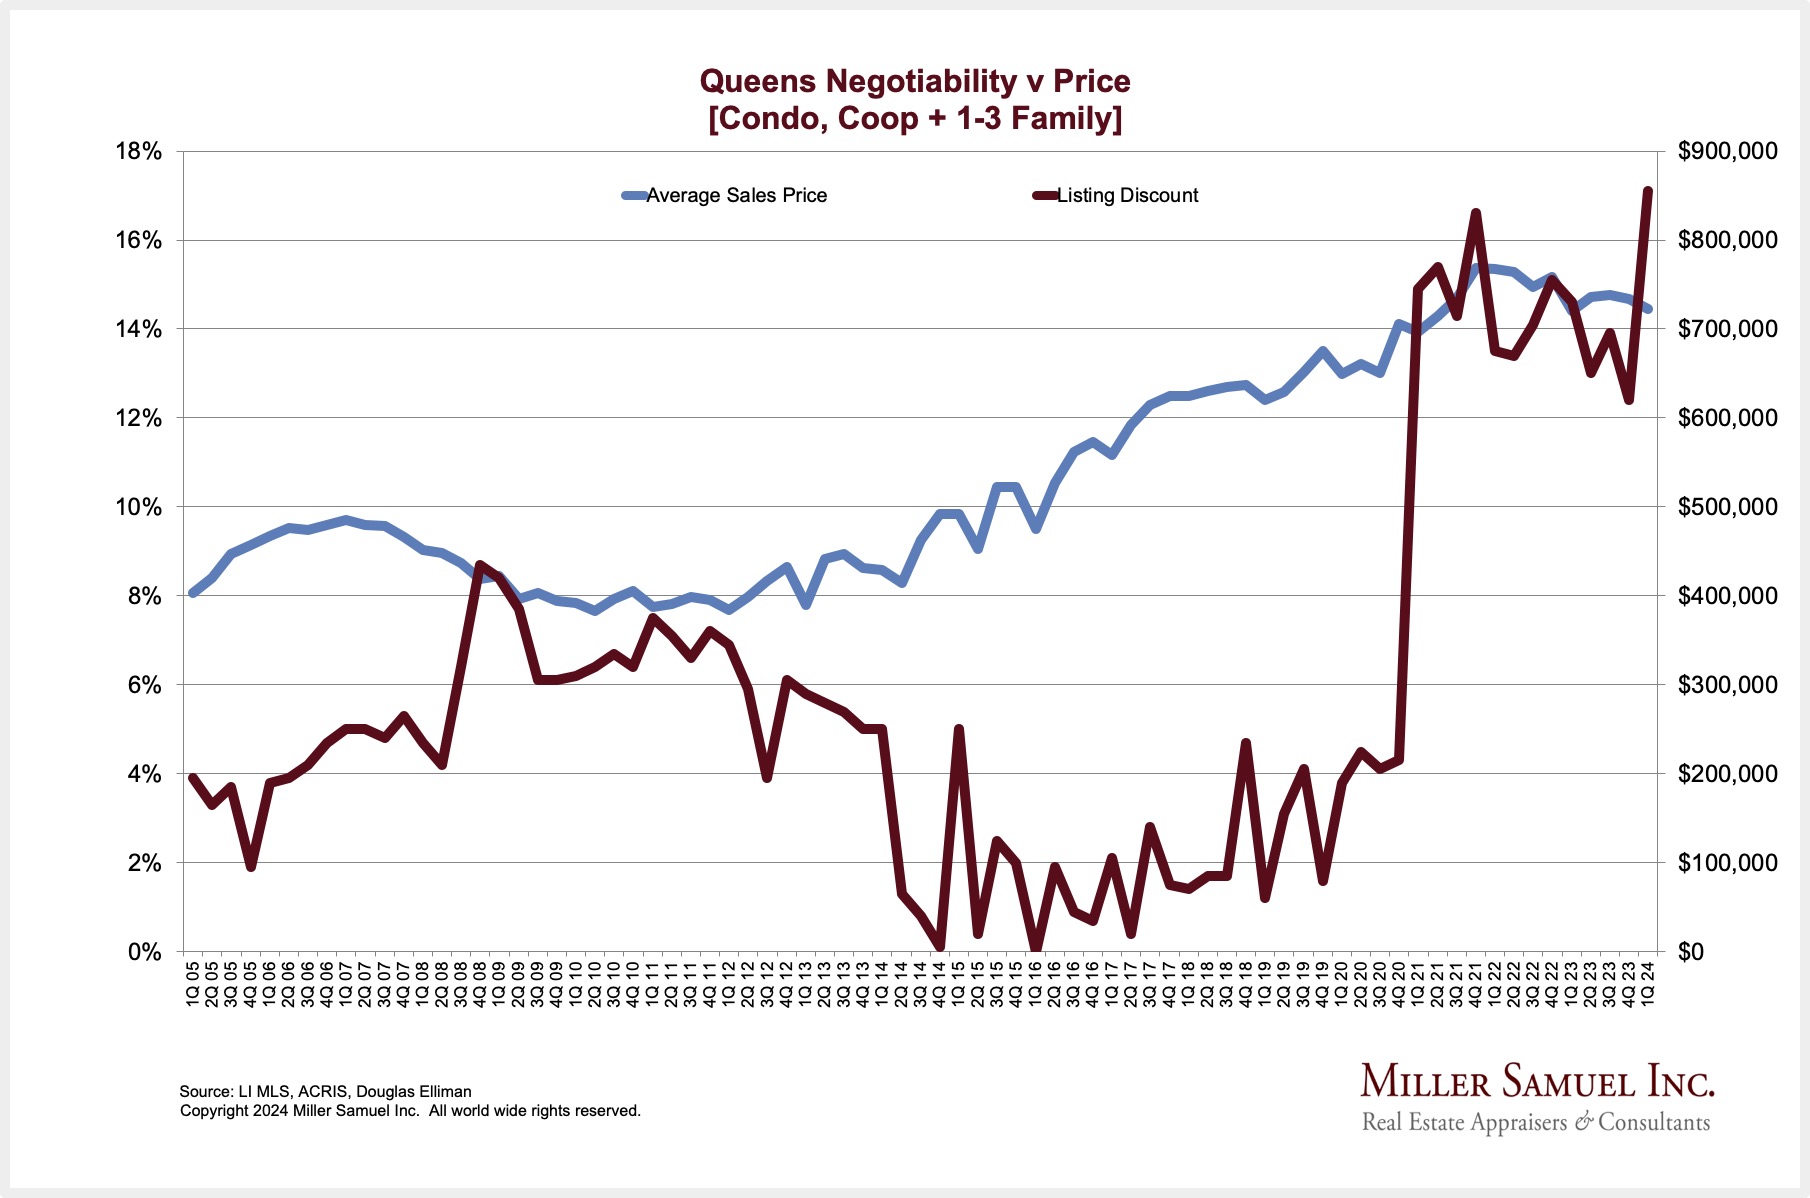
Queens Negotiability v. Price [Condo, Co-op, 1-3 Family]
read more
April 11, 2024
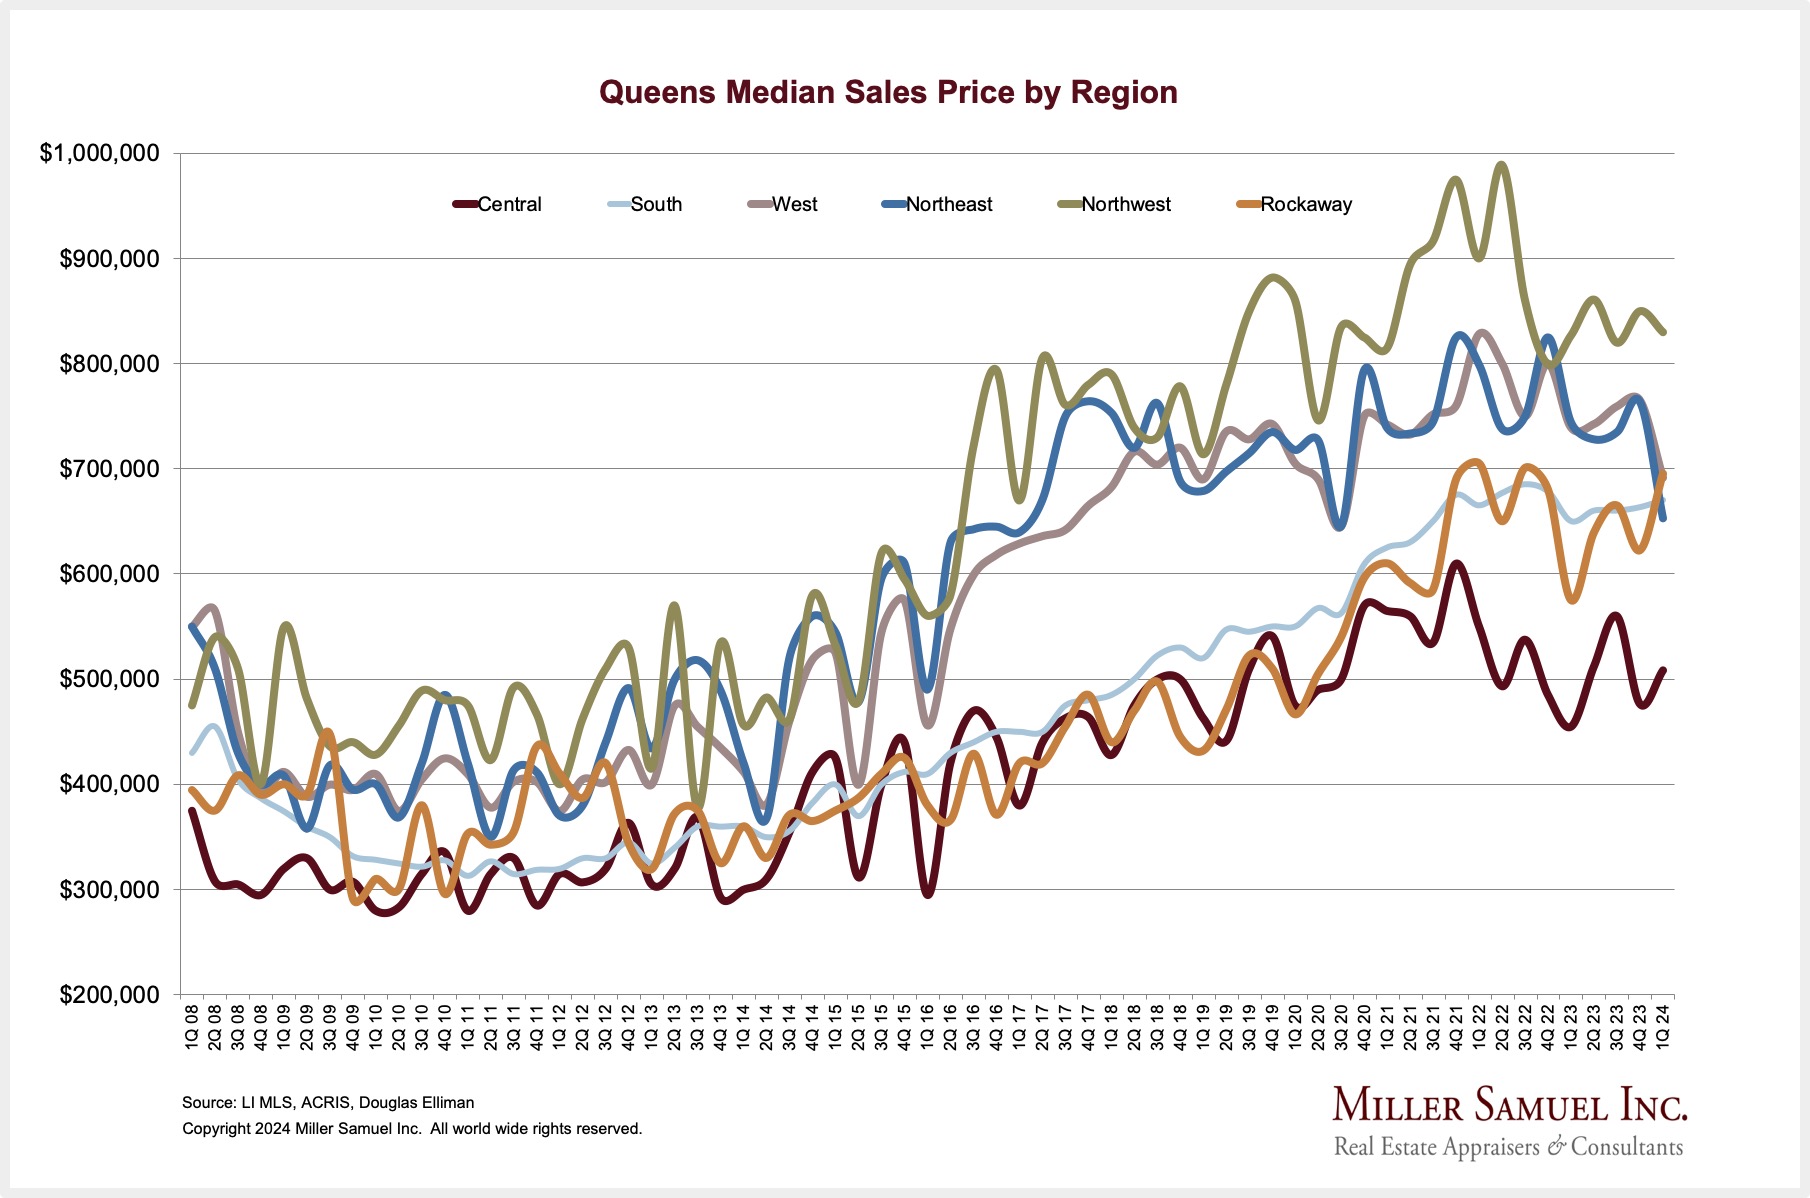
Queens Median Sales Price by Region
read more
April 11, 2024
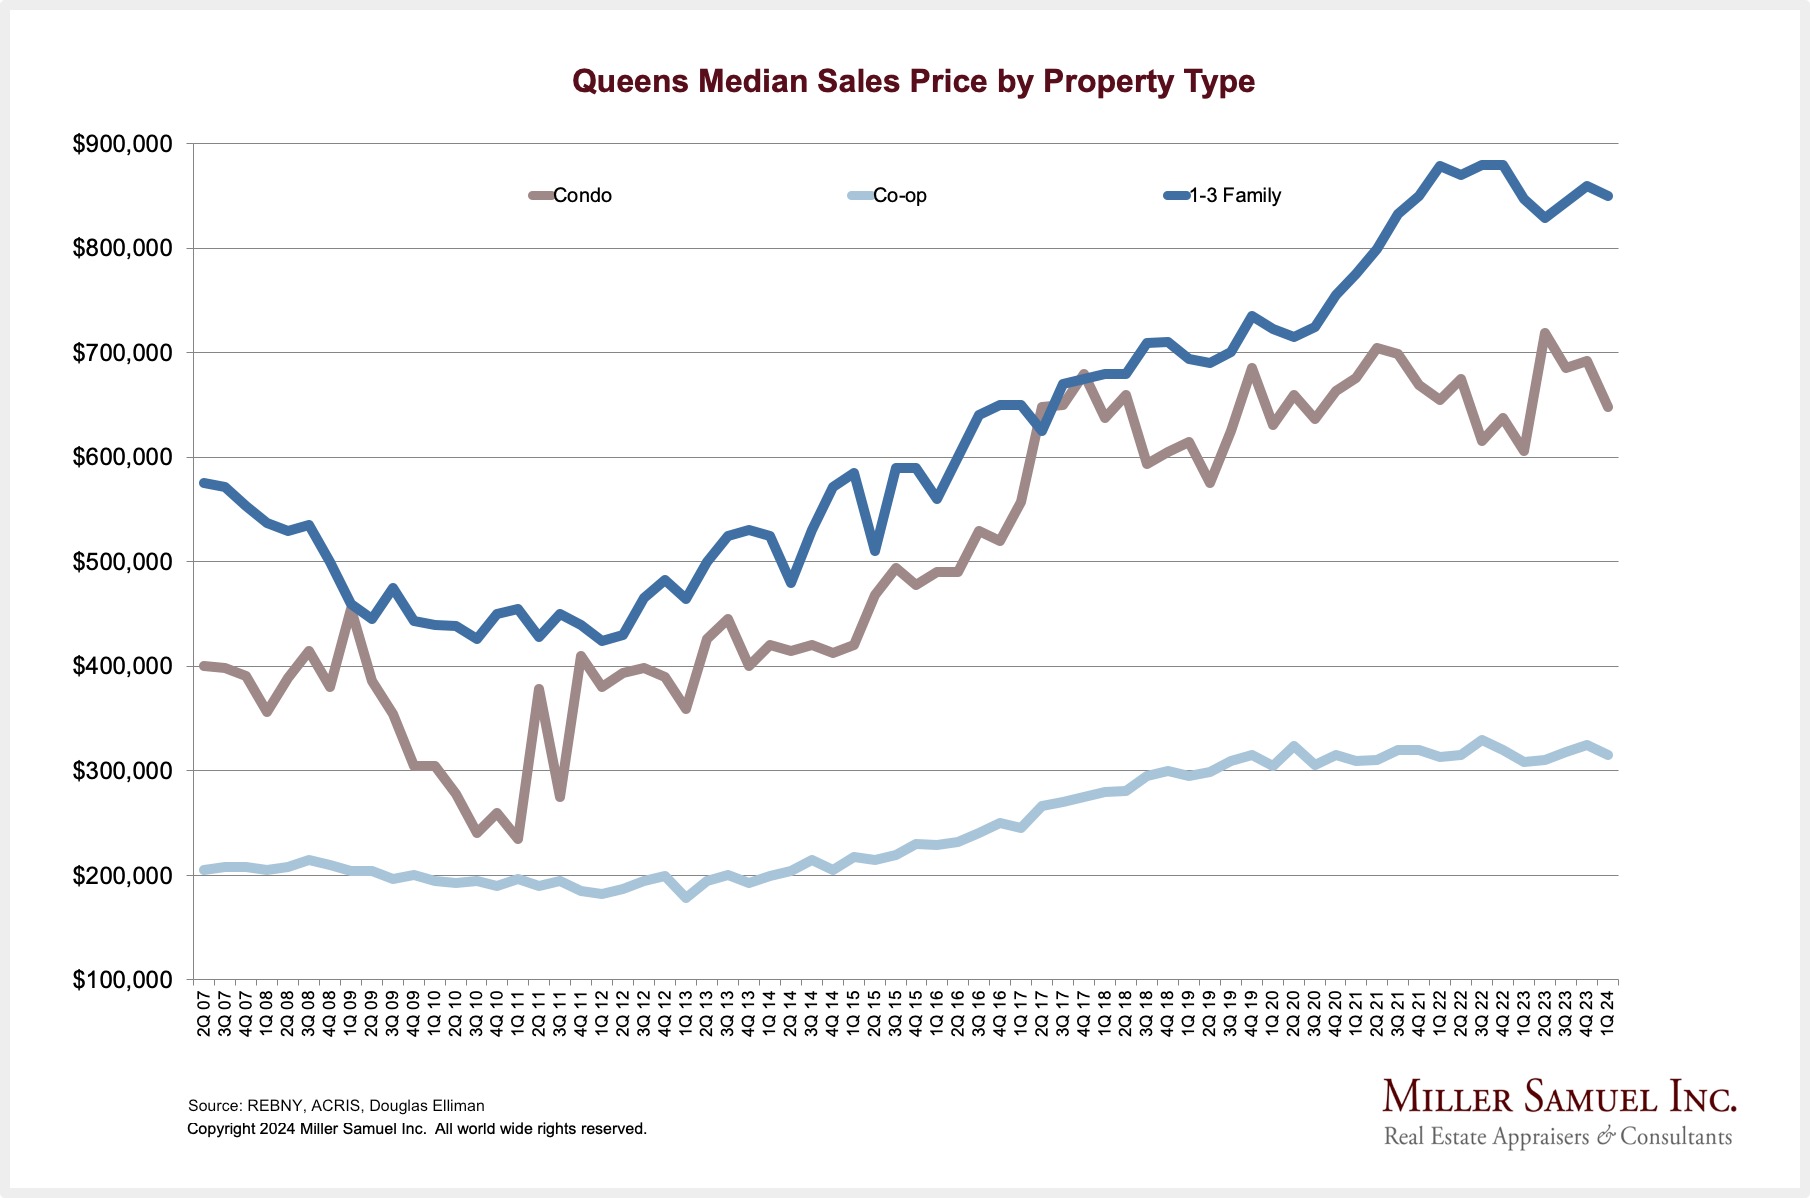
Queens Median Sales Price by Property Type
read more
April 11, 2024
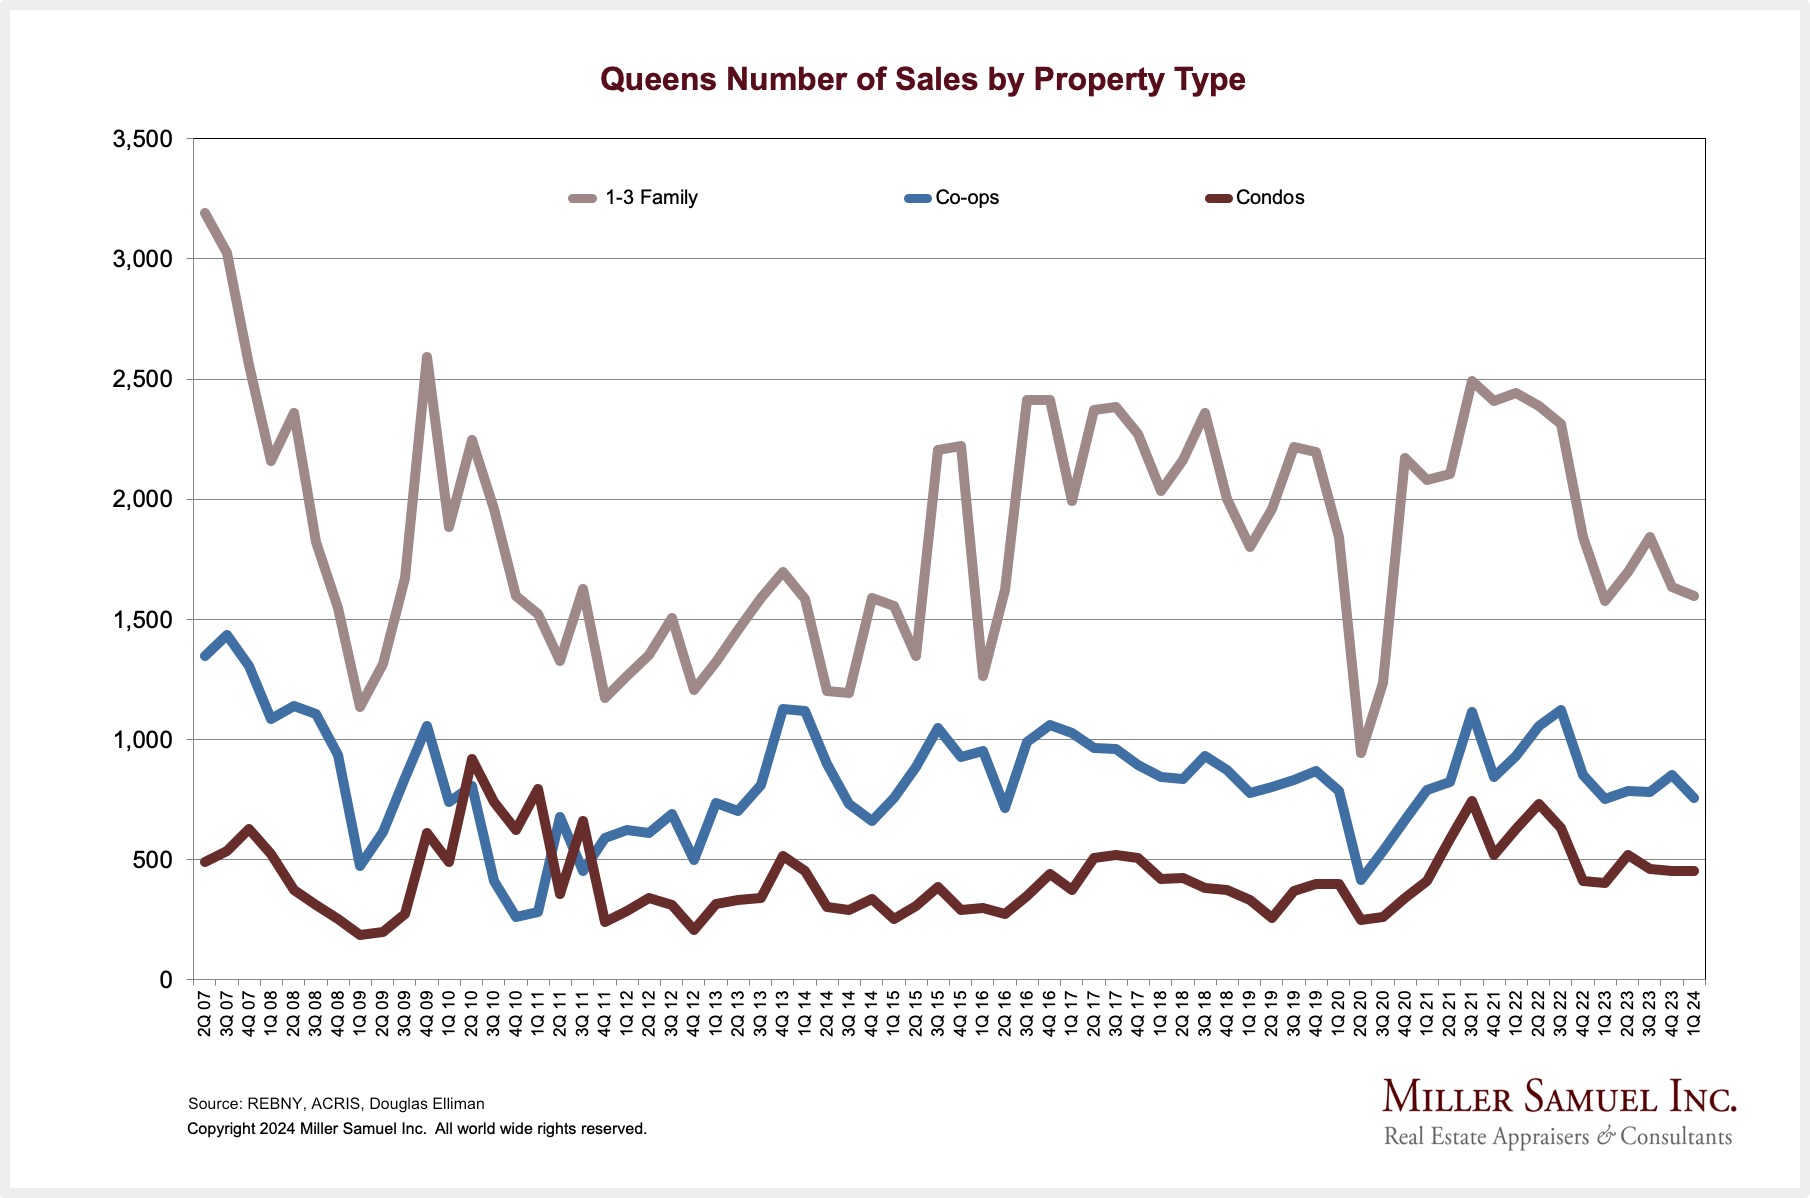
Queens Number of Sales by Property Type
read more
April 11, 2024
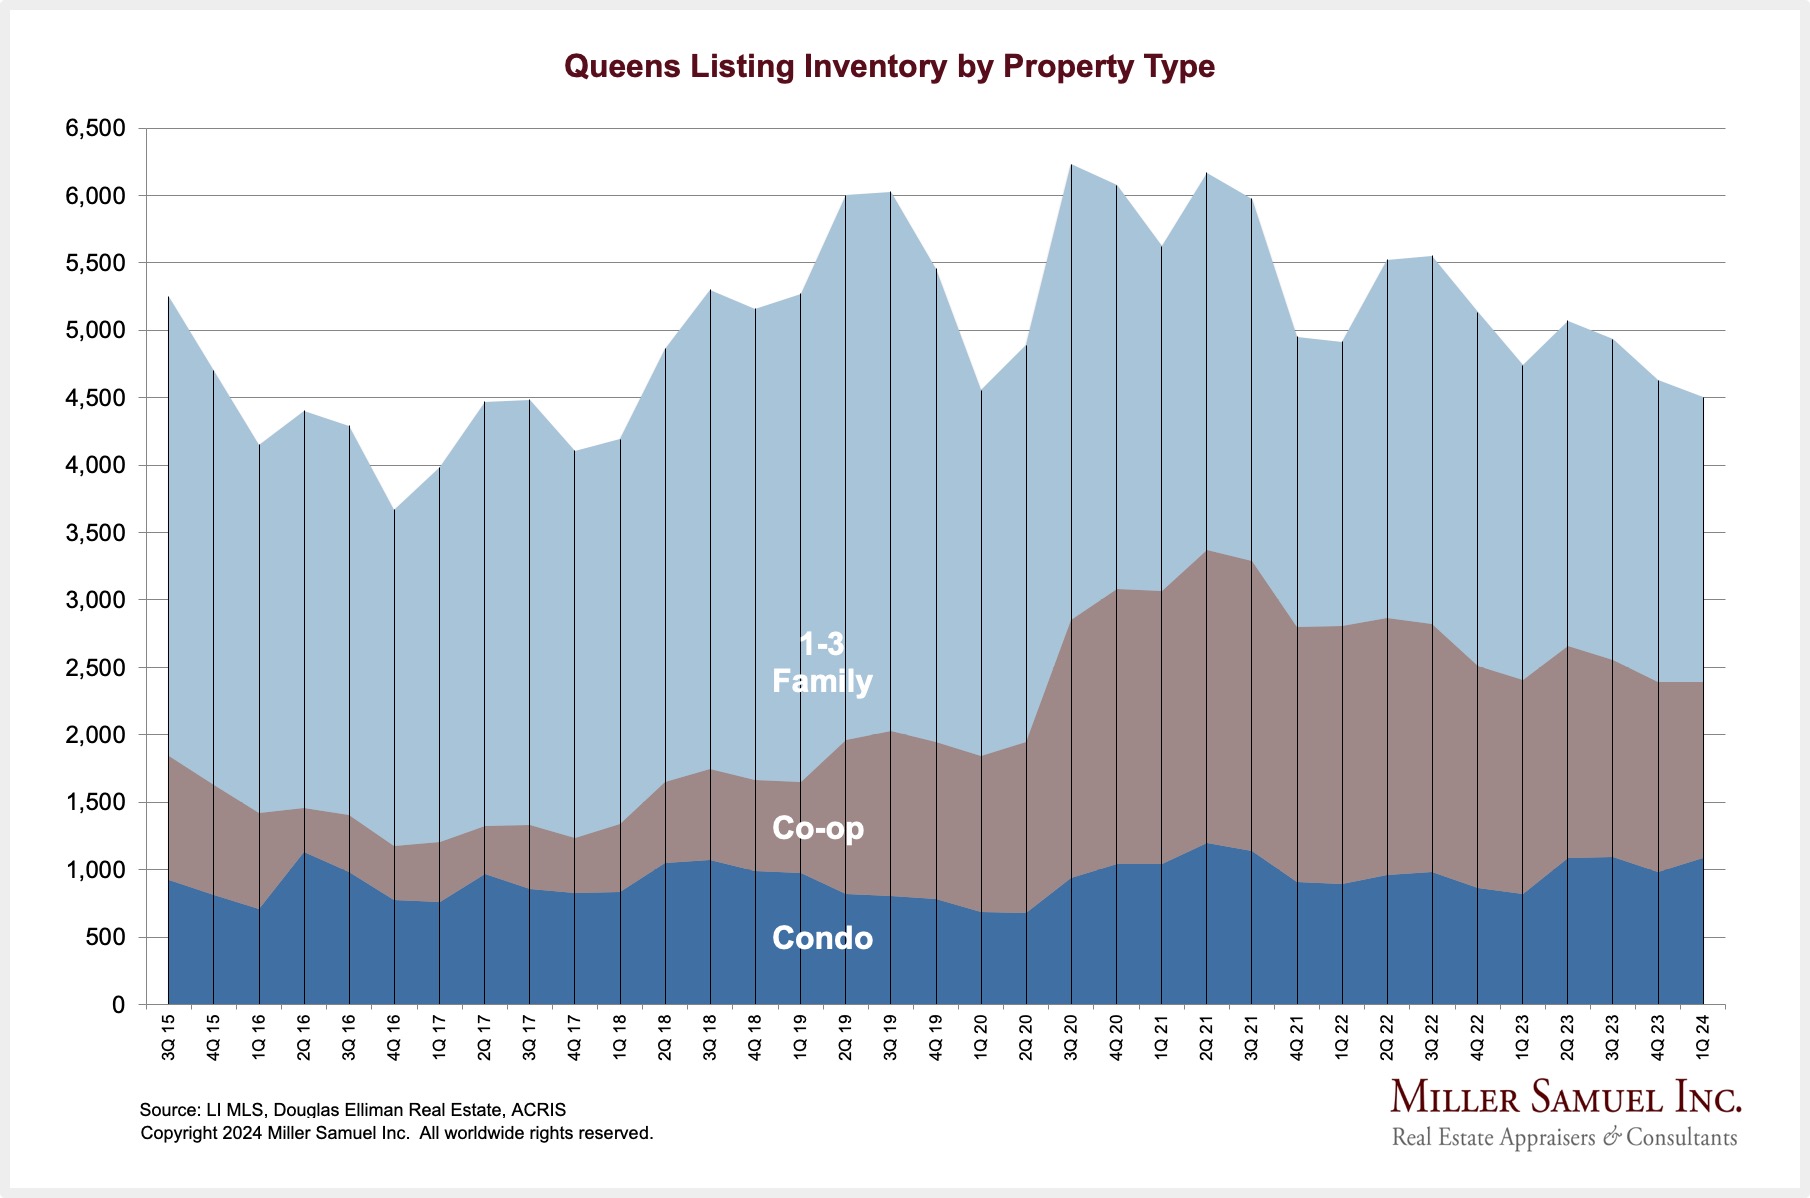
Queens Listing Inventory by Property Type
read more
April 11, 2024
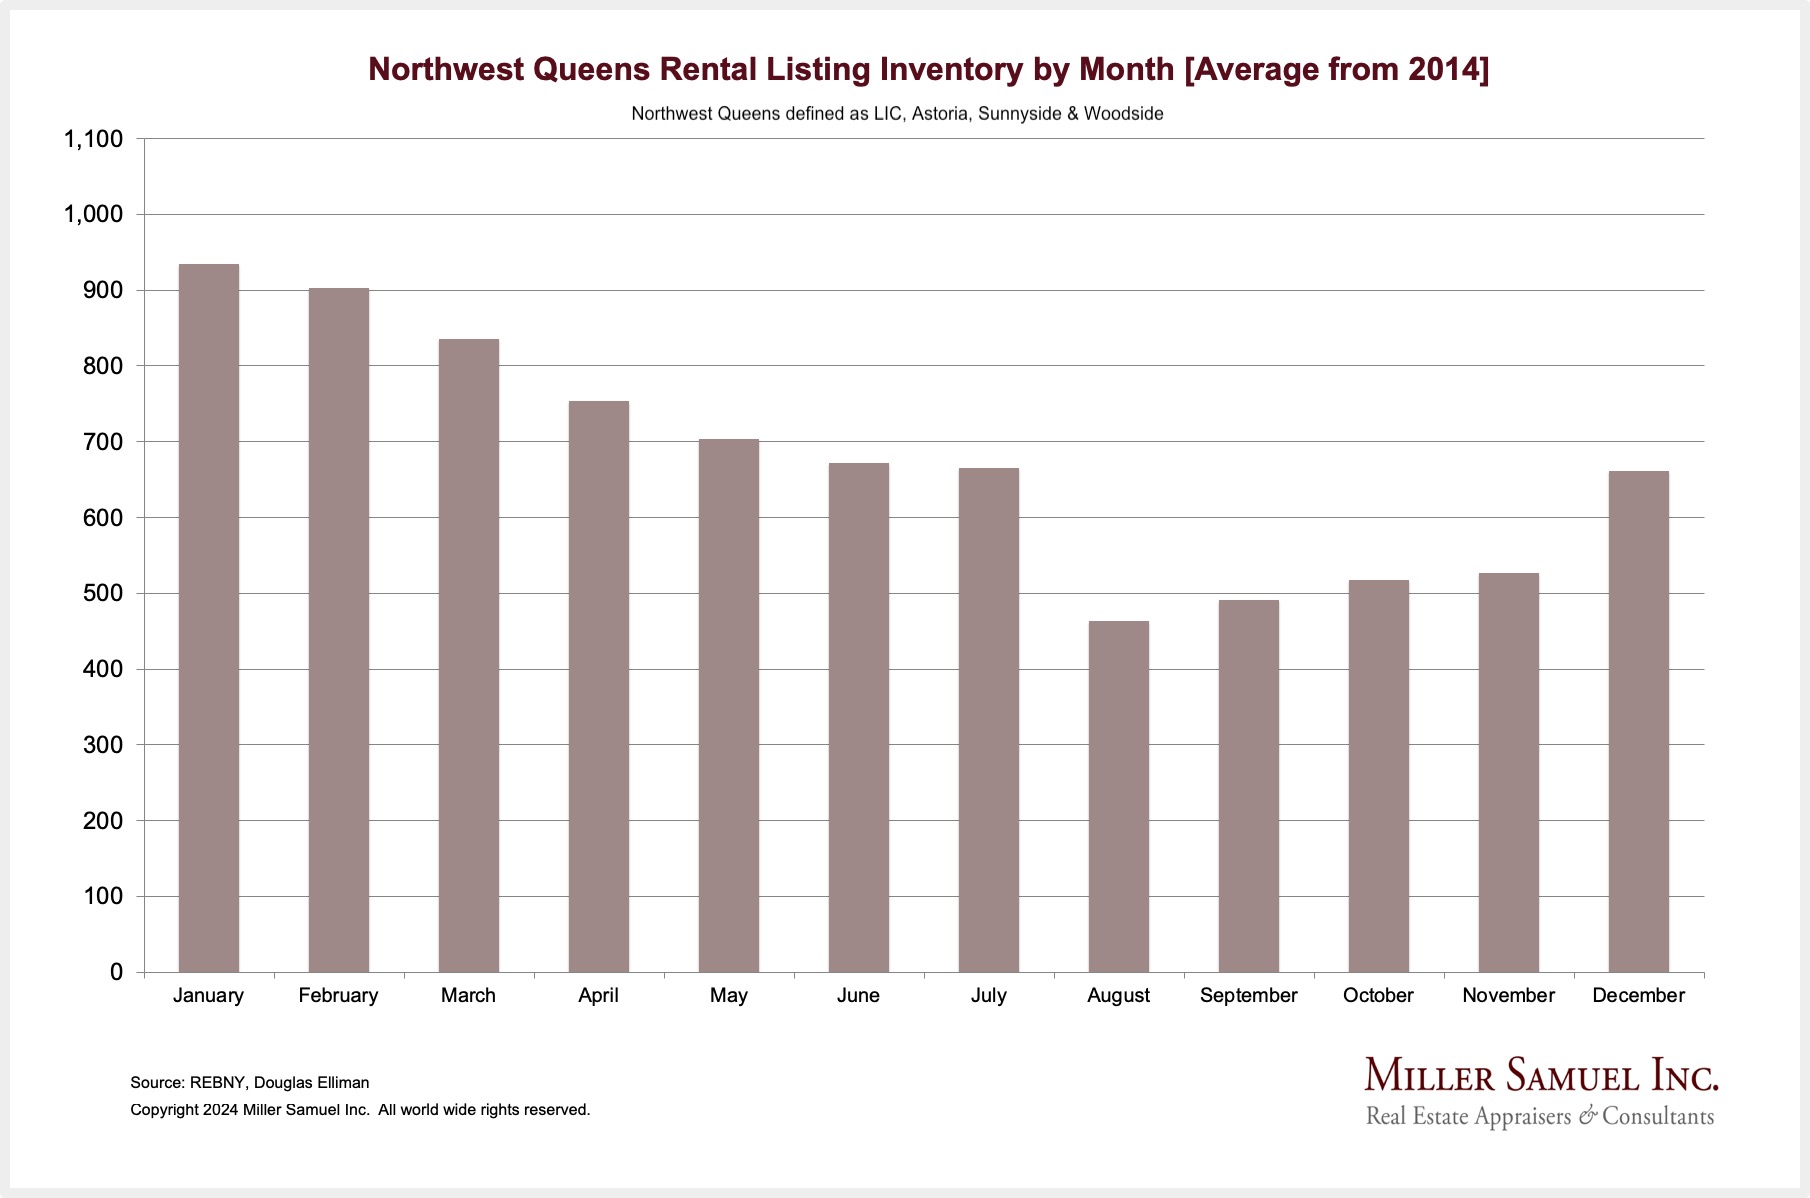
NW Queens Rental Listing Inventory by Month [Average from 2014]
read more
April 11, 2024
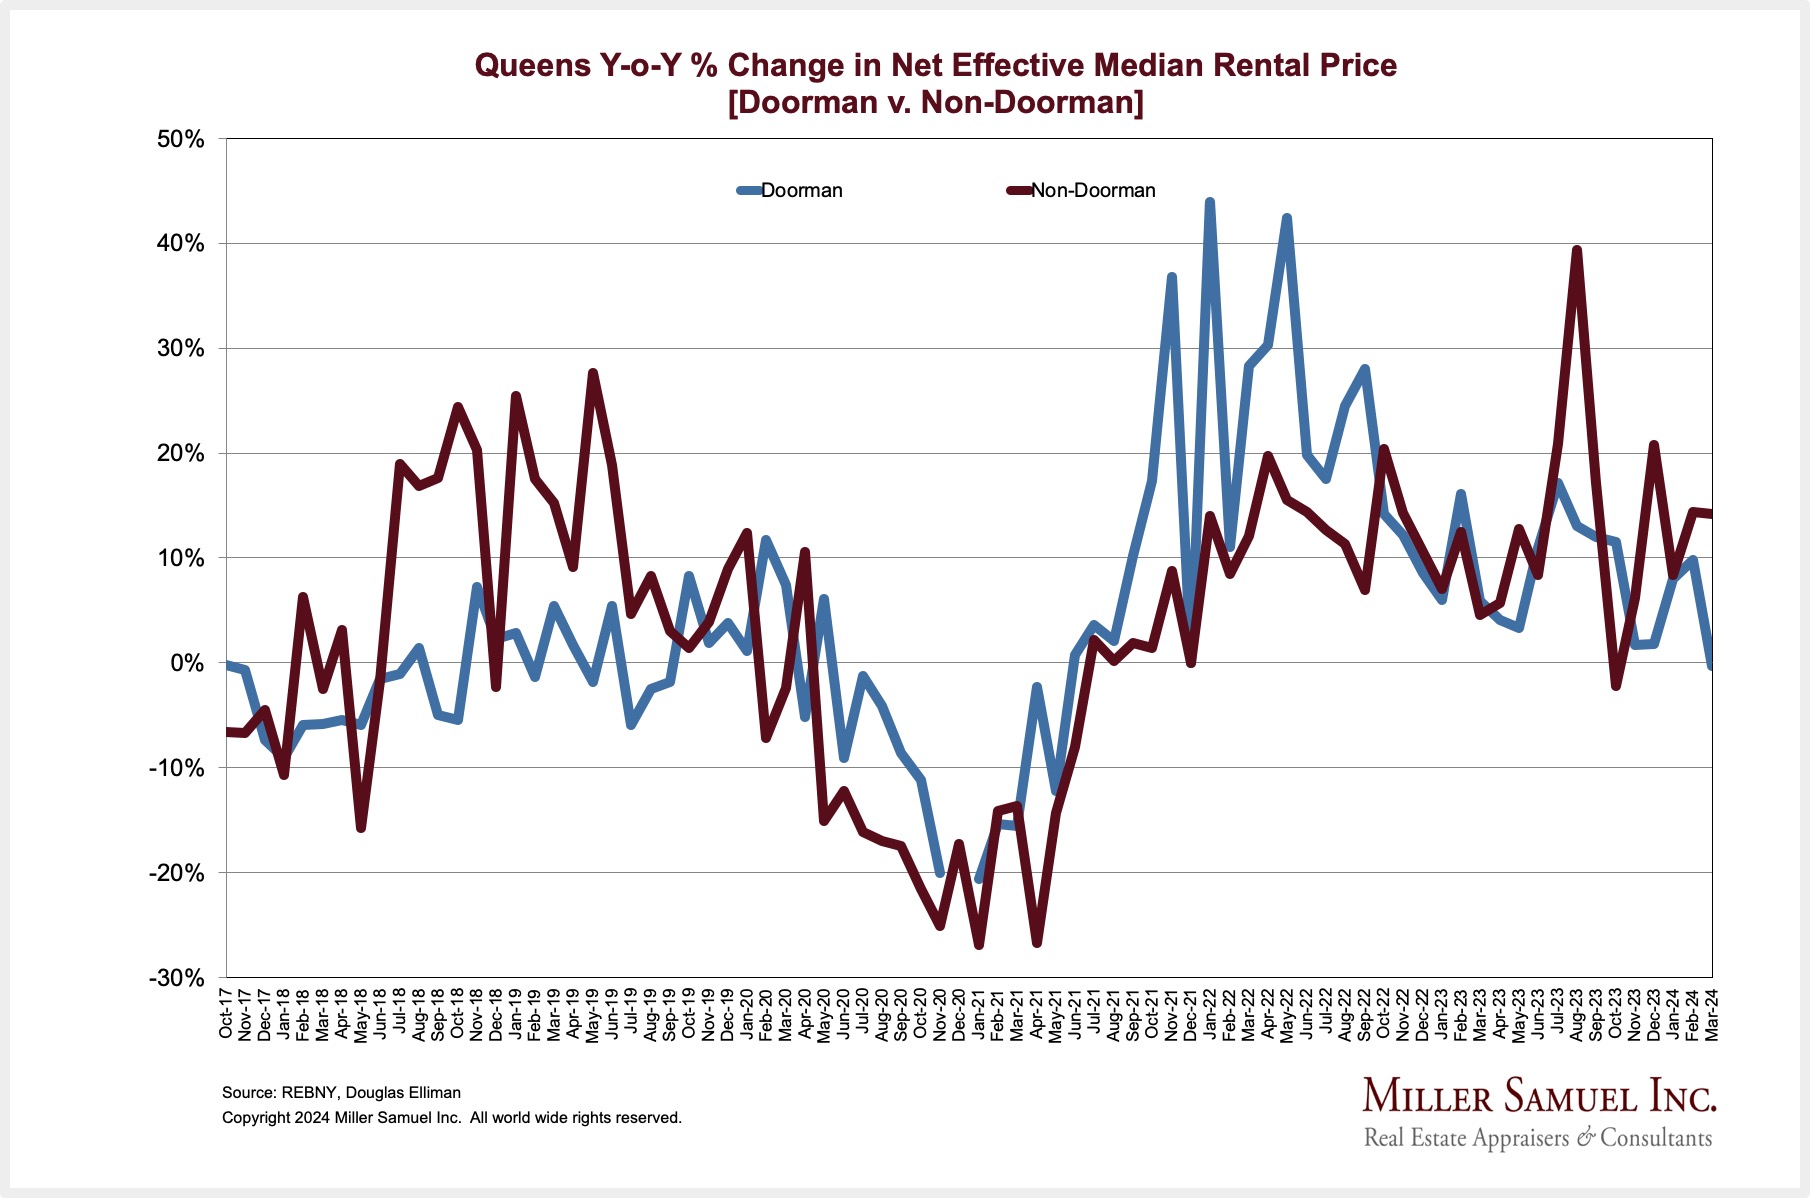
Queens Y-o-Y % Change in Net Effective Median Rental Price [Doorman v. Non-Doorman]
read more
1
2
Next
Load More Charts
Page load link
Go to Top