Skip to content
Services
Appraisals
Consulting
Resources
Market Reports
Charts
Matrix Blog
Articles & Research
Press
About
get in touch
Market Reports
›
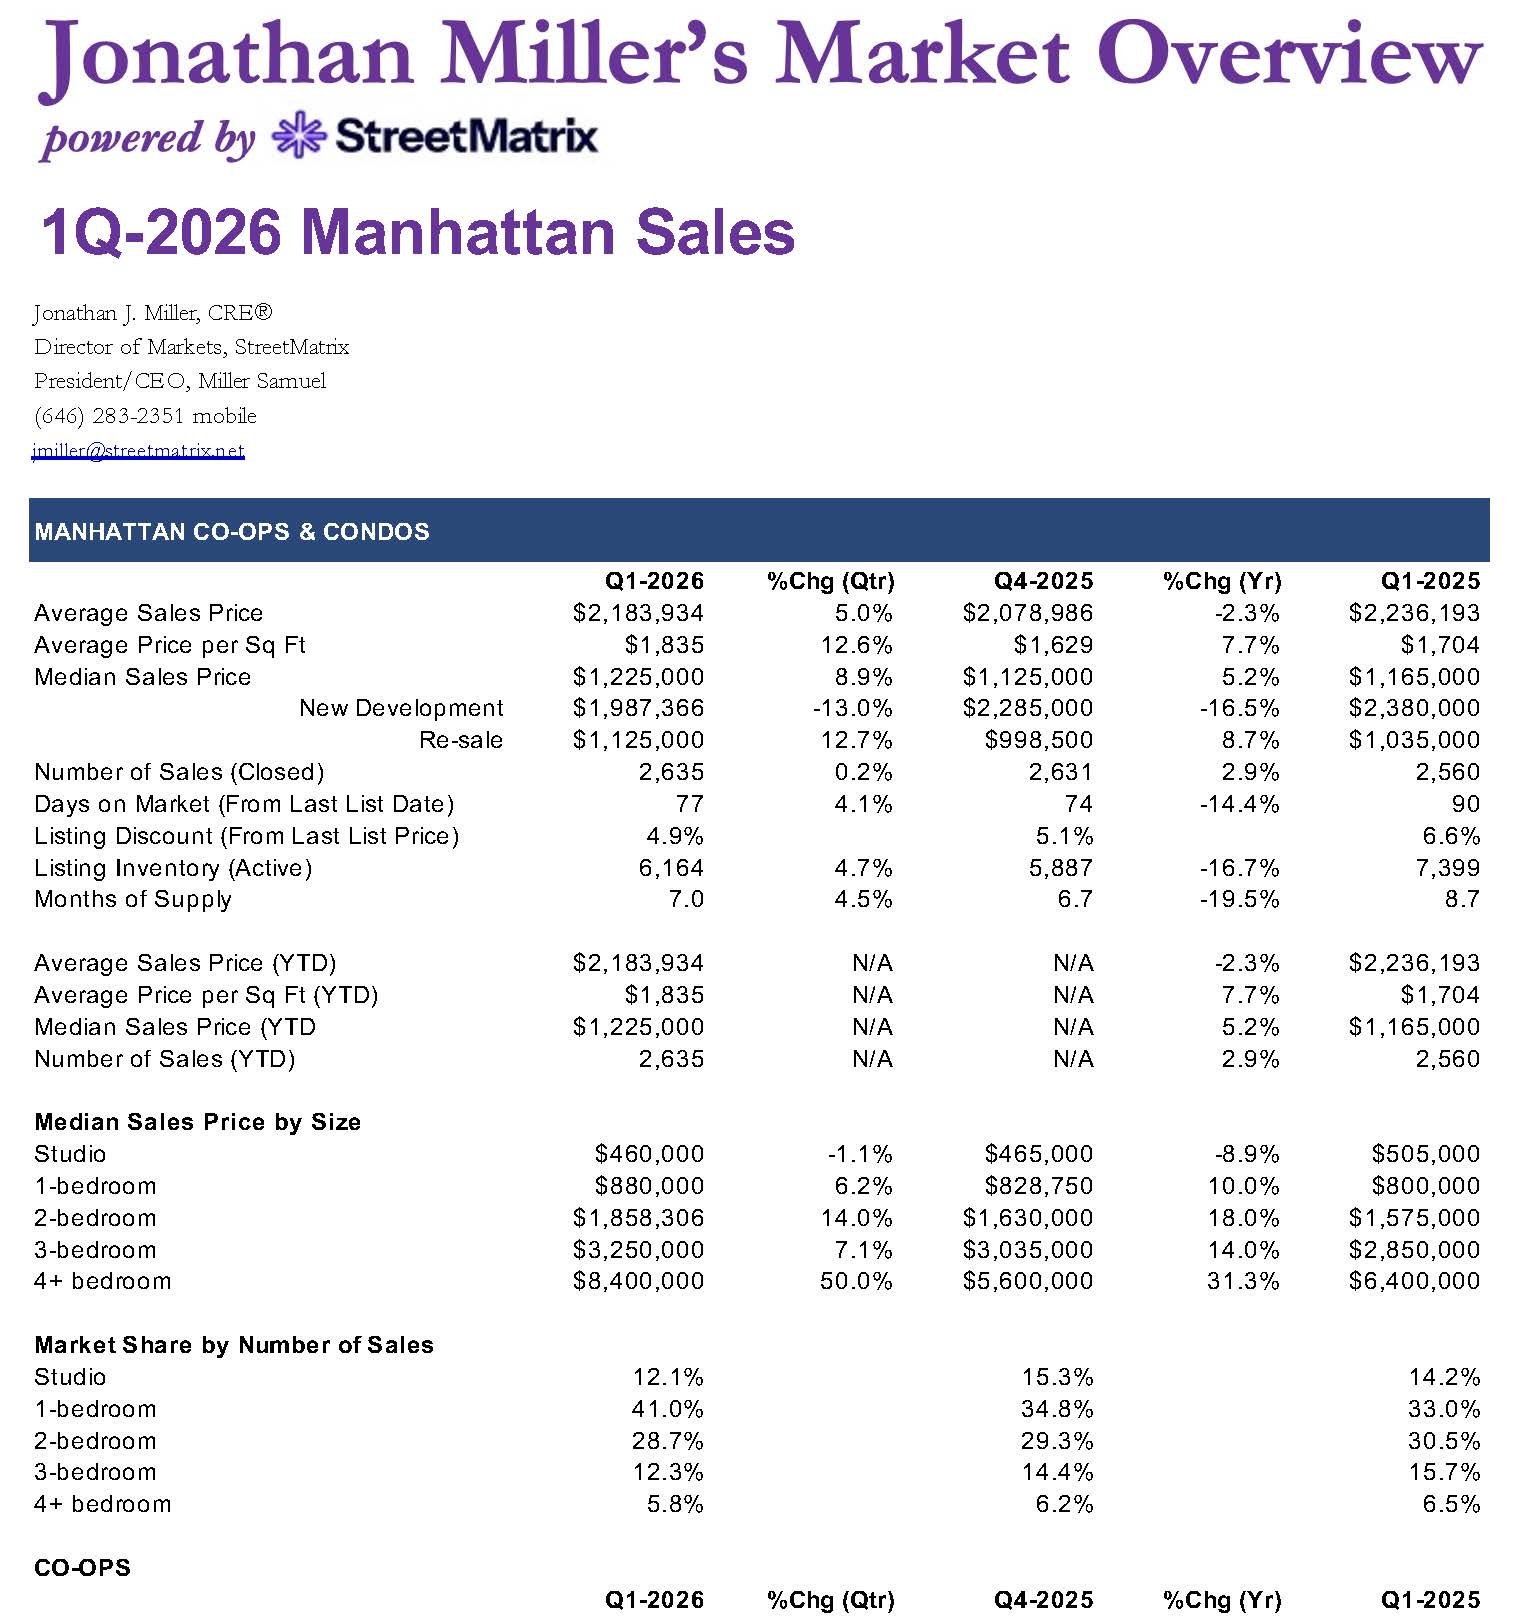
April 2, 2026
Jonathan Miller’s Market Report: Manhattan Sales 1Q 2026
read more
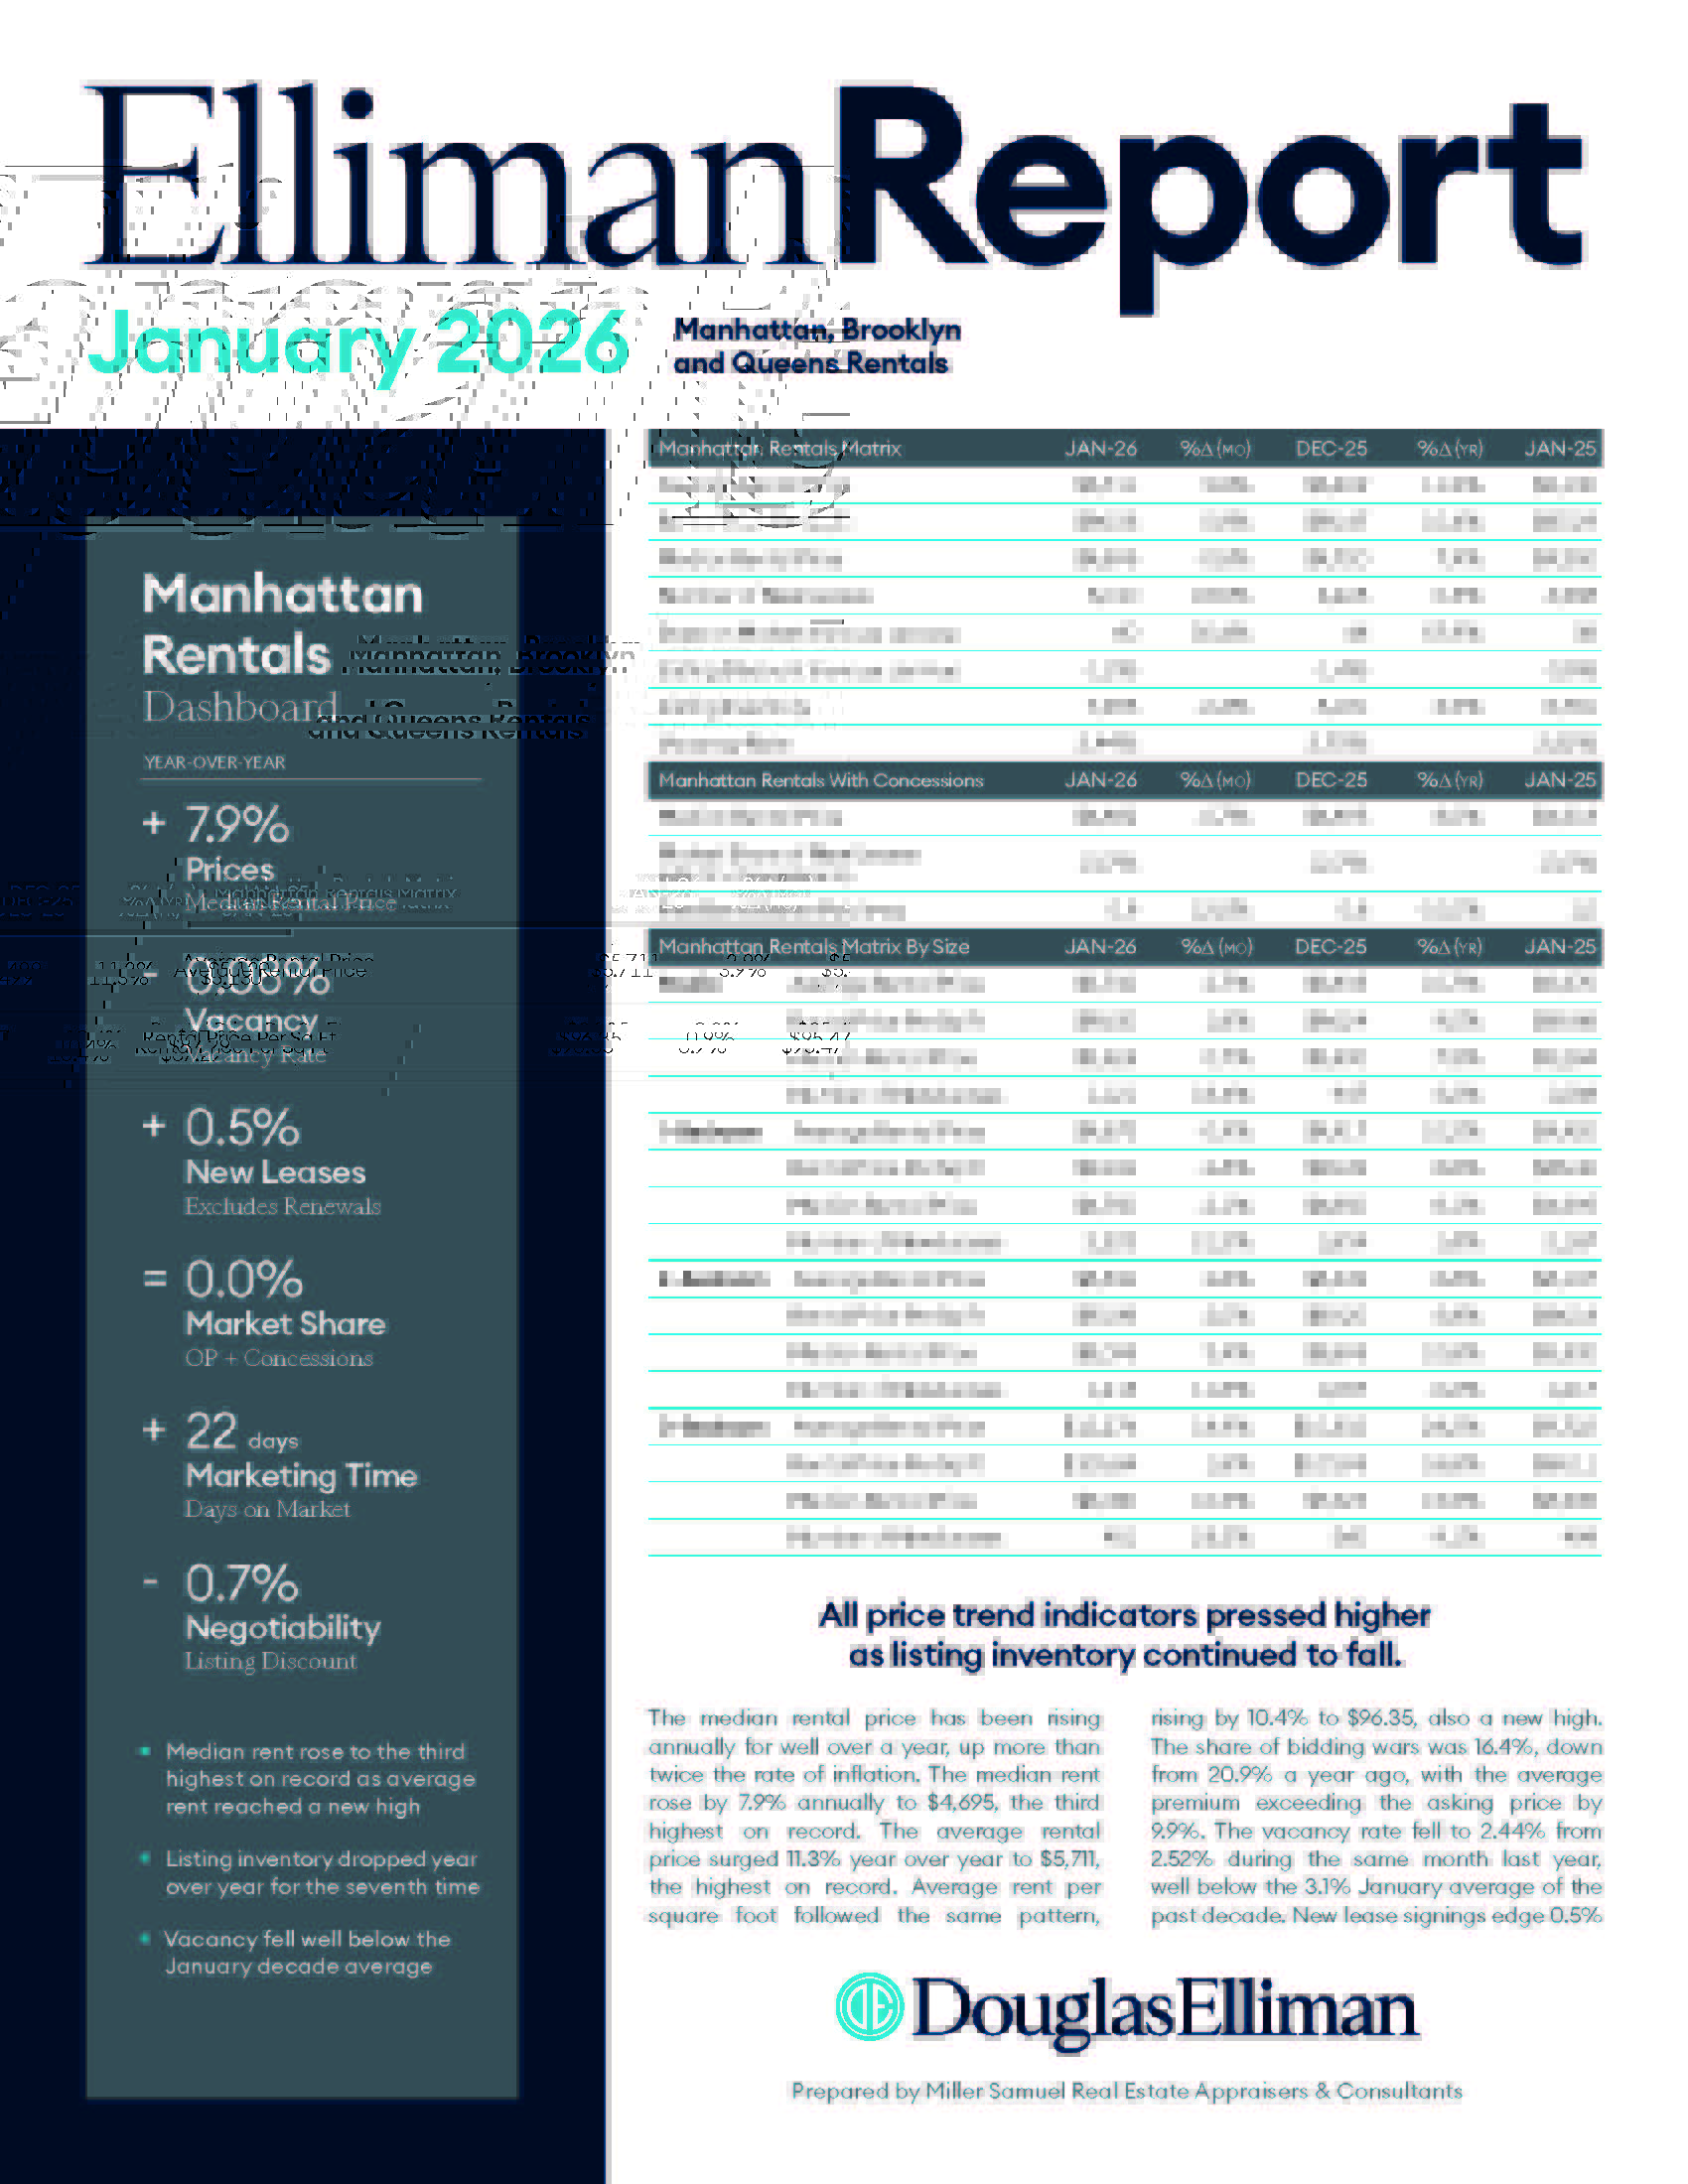
February 12, 2026
Elliman Report: Manhattan, Brooklyn & Queens Rentals 1-2026
read more
February 5, 2026
Elliman Report: Manhattan Decade 2016-2025
read more
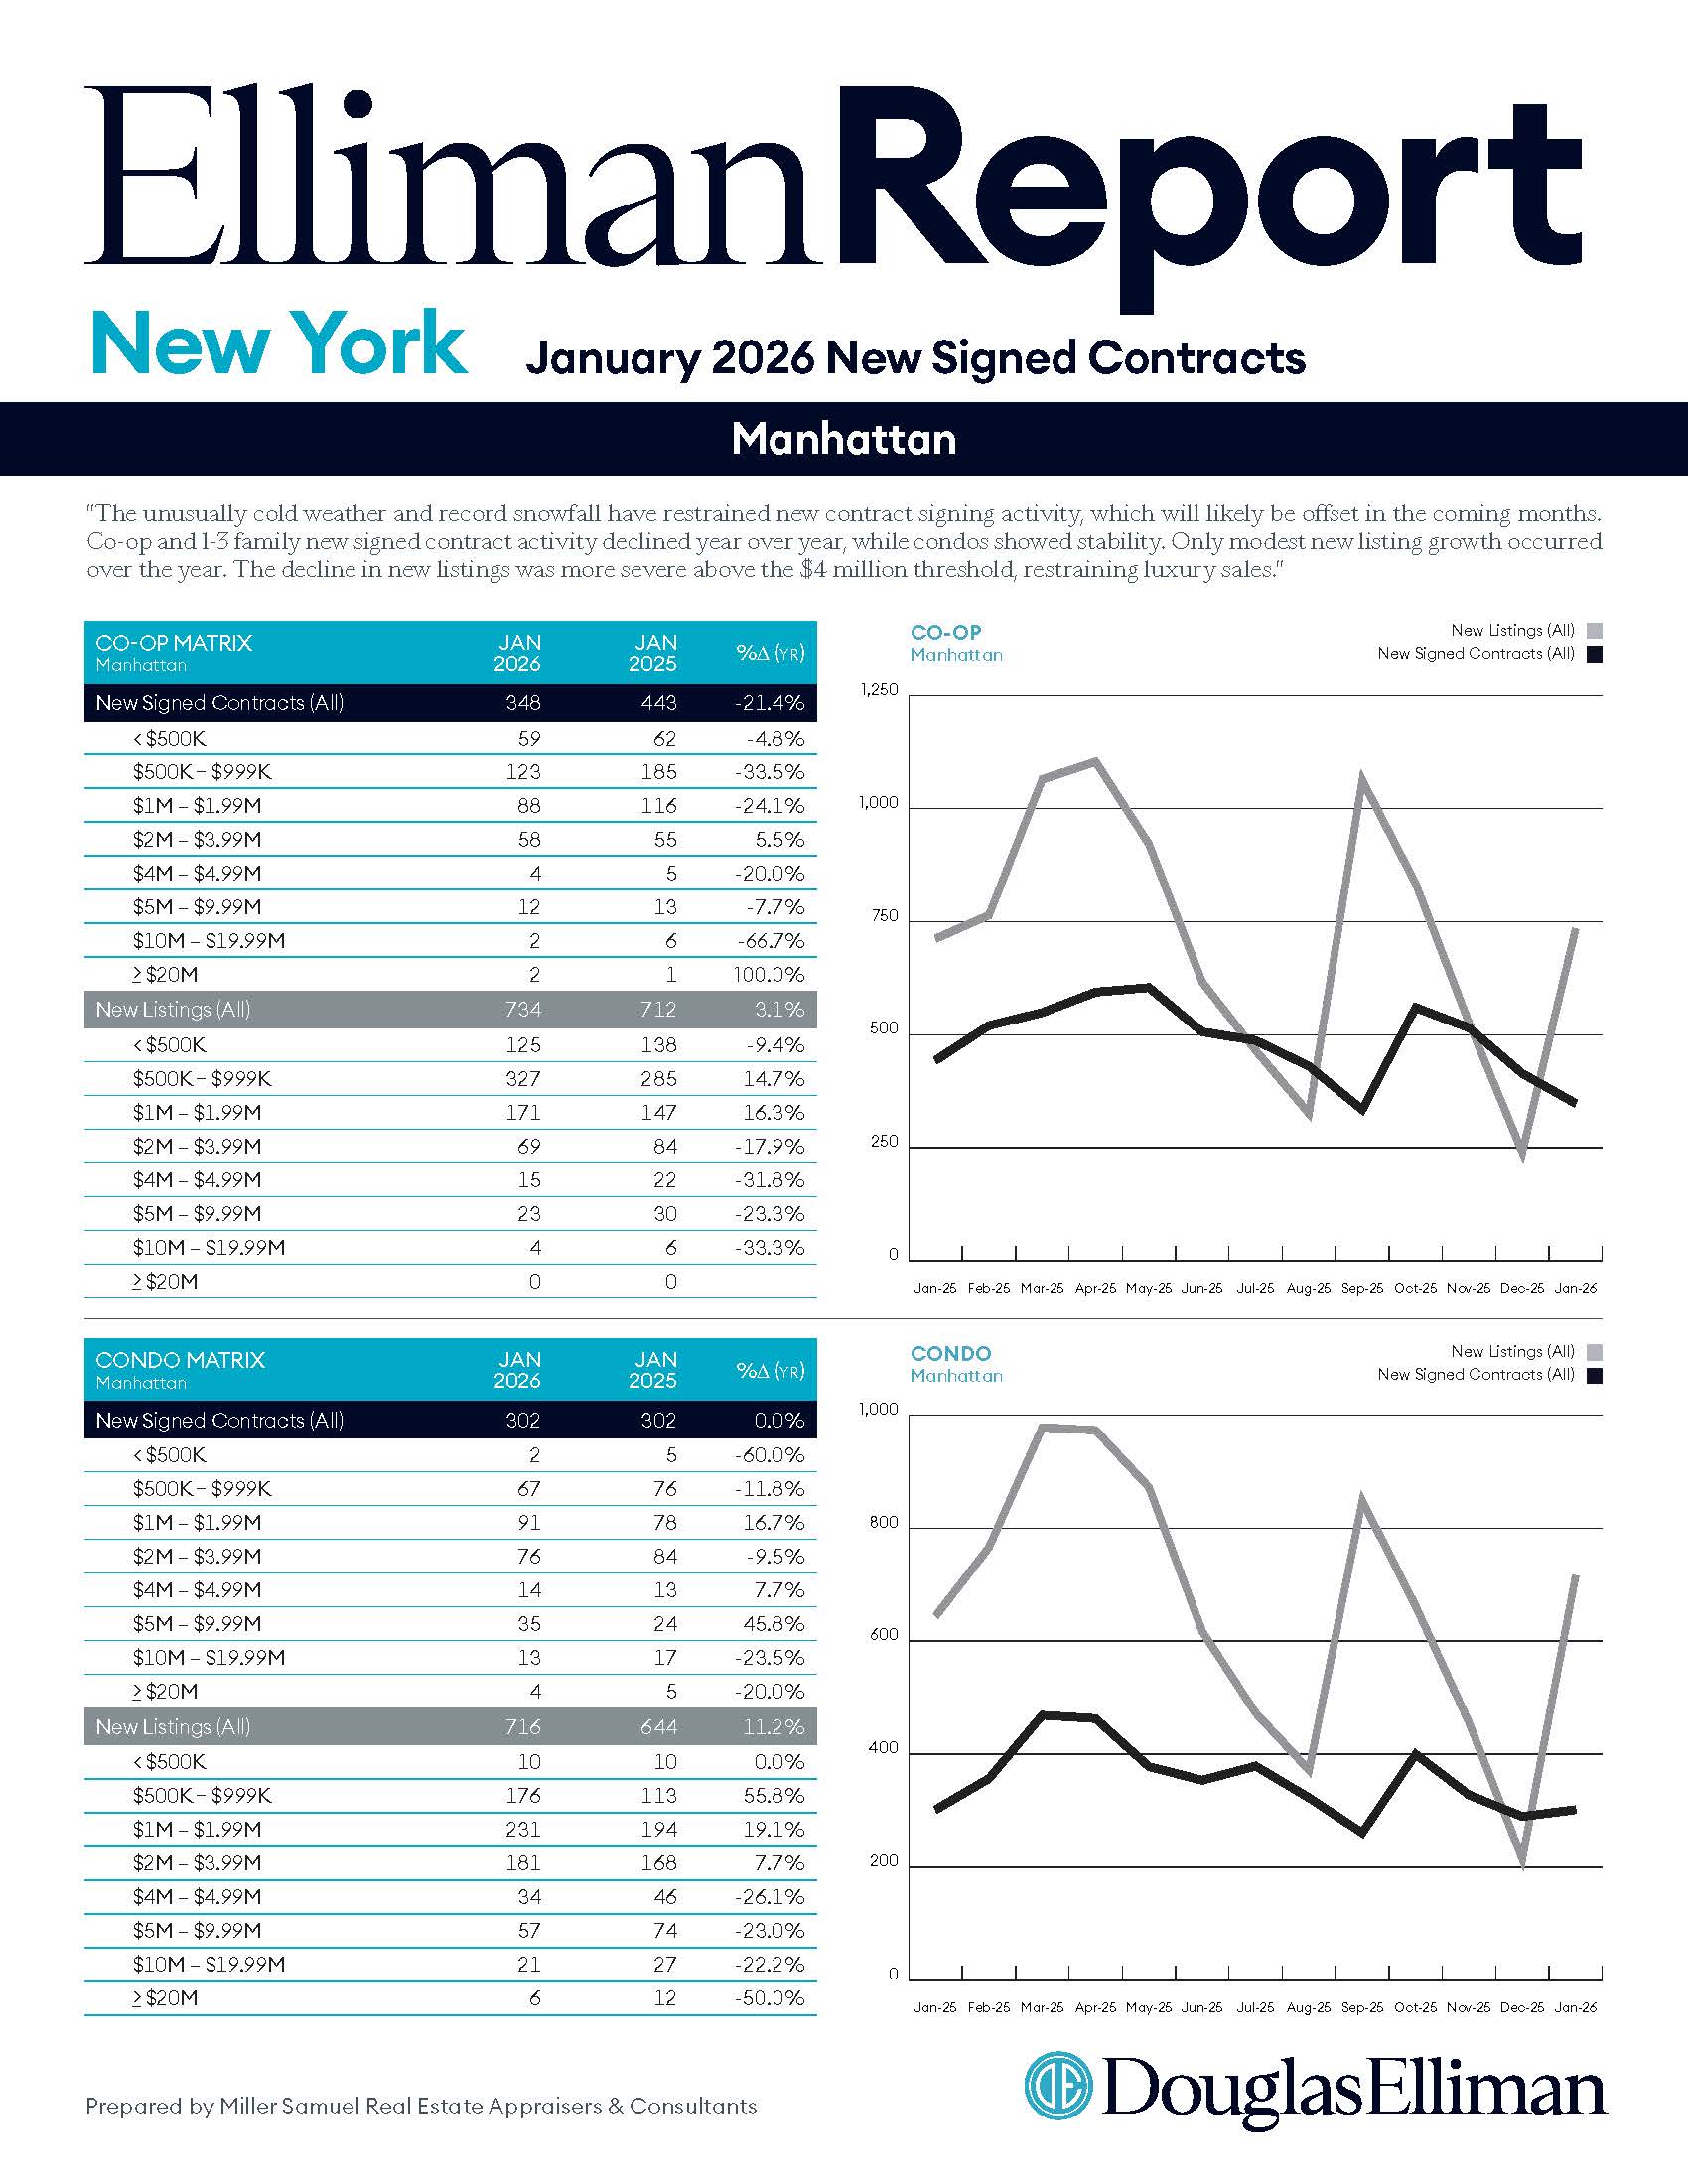
February 5, 2026
Elliman Report: New York New Signed Contracts 1-2026
read more
February 5, 2026
Elliman Report: Florida New Signed Contracts 1-2026
read more
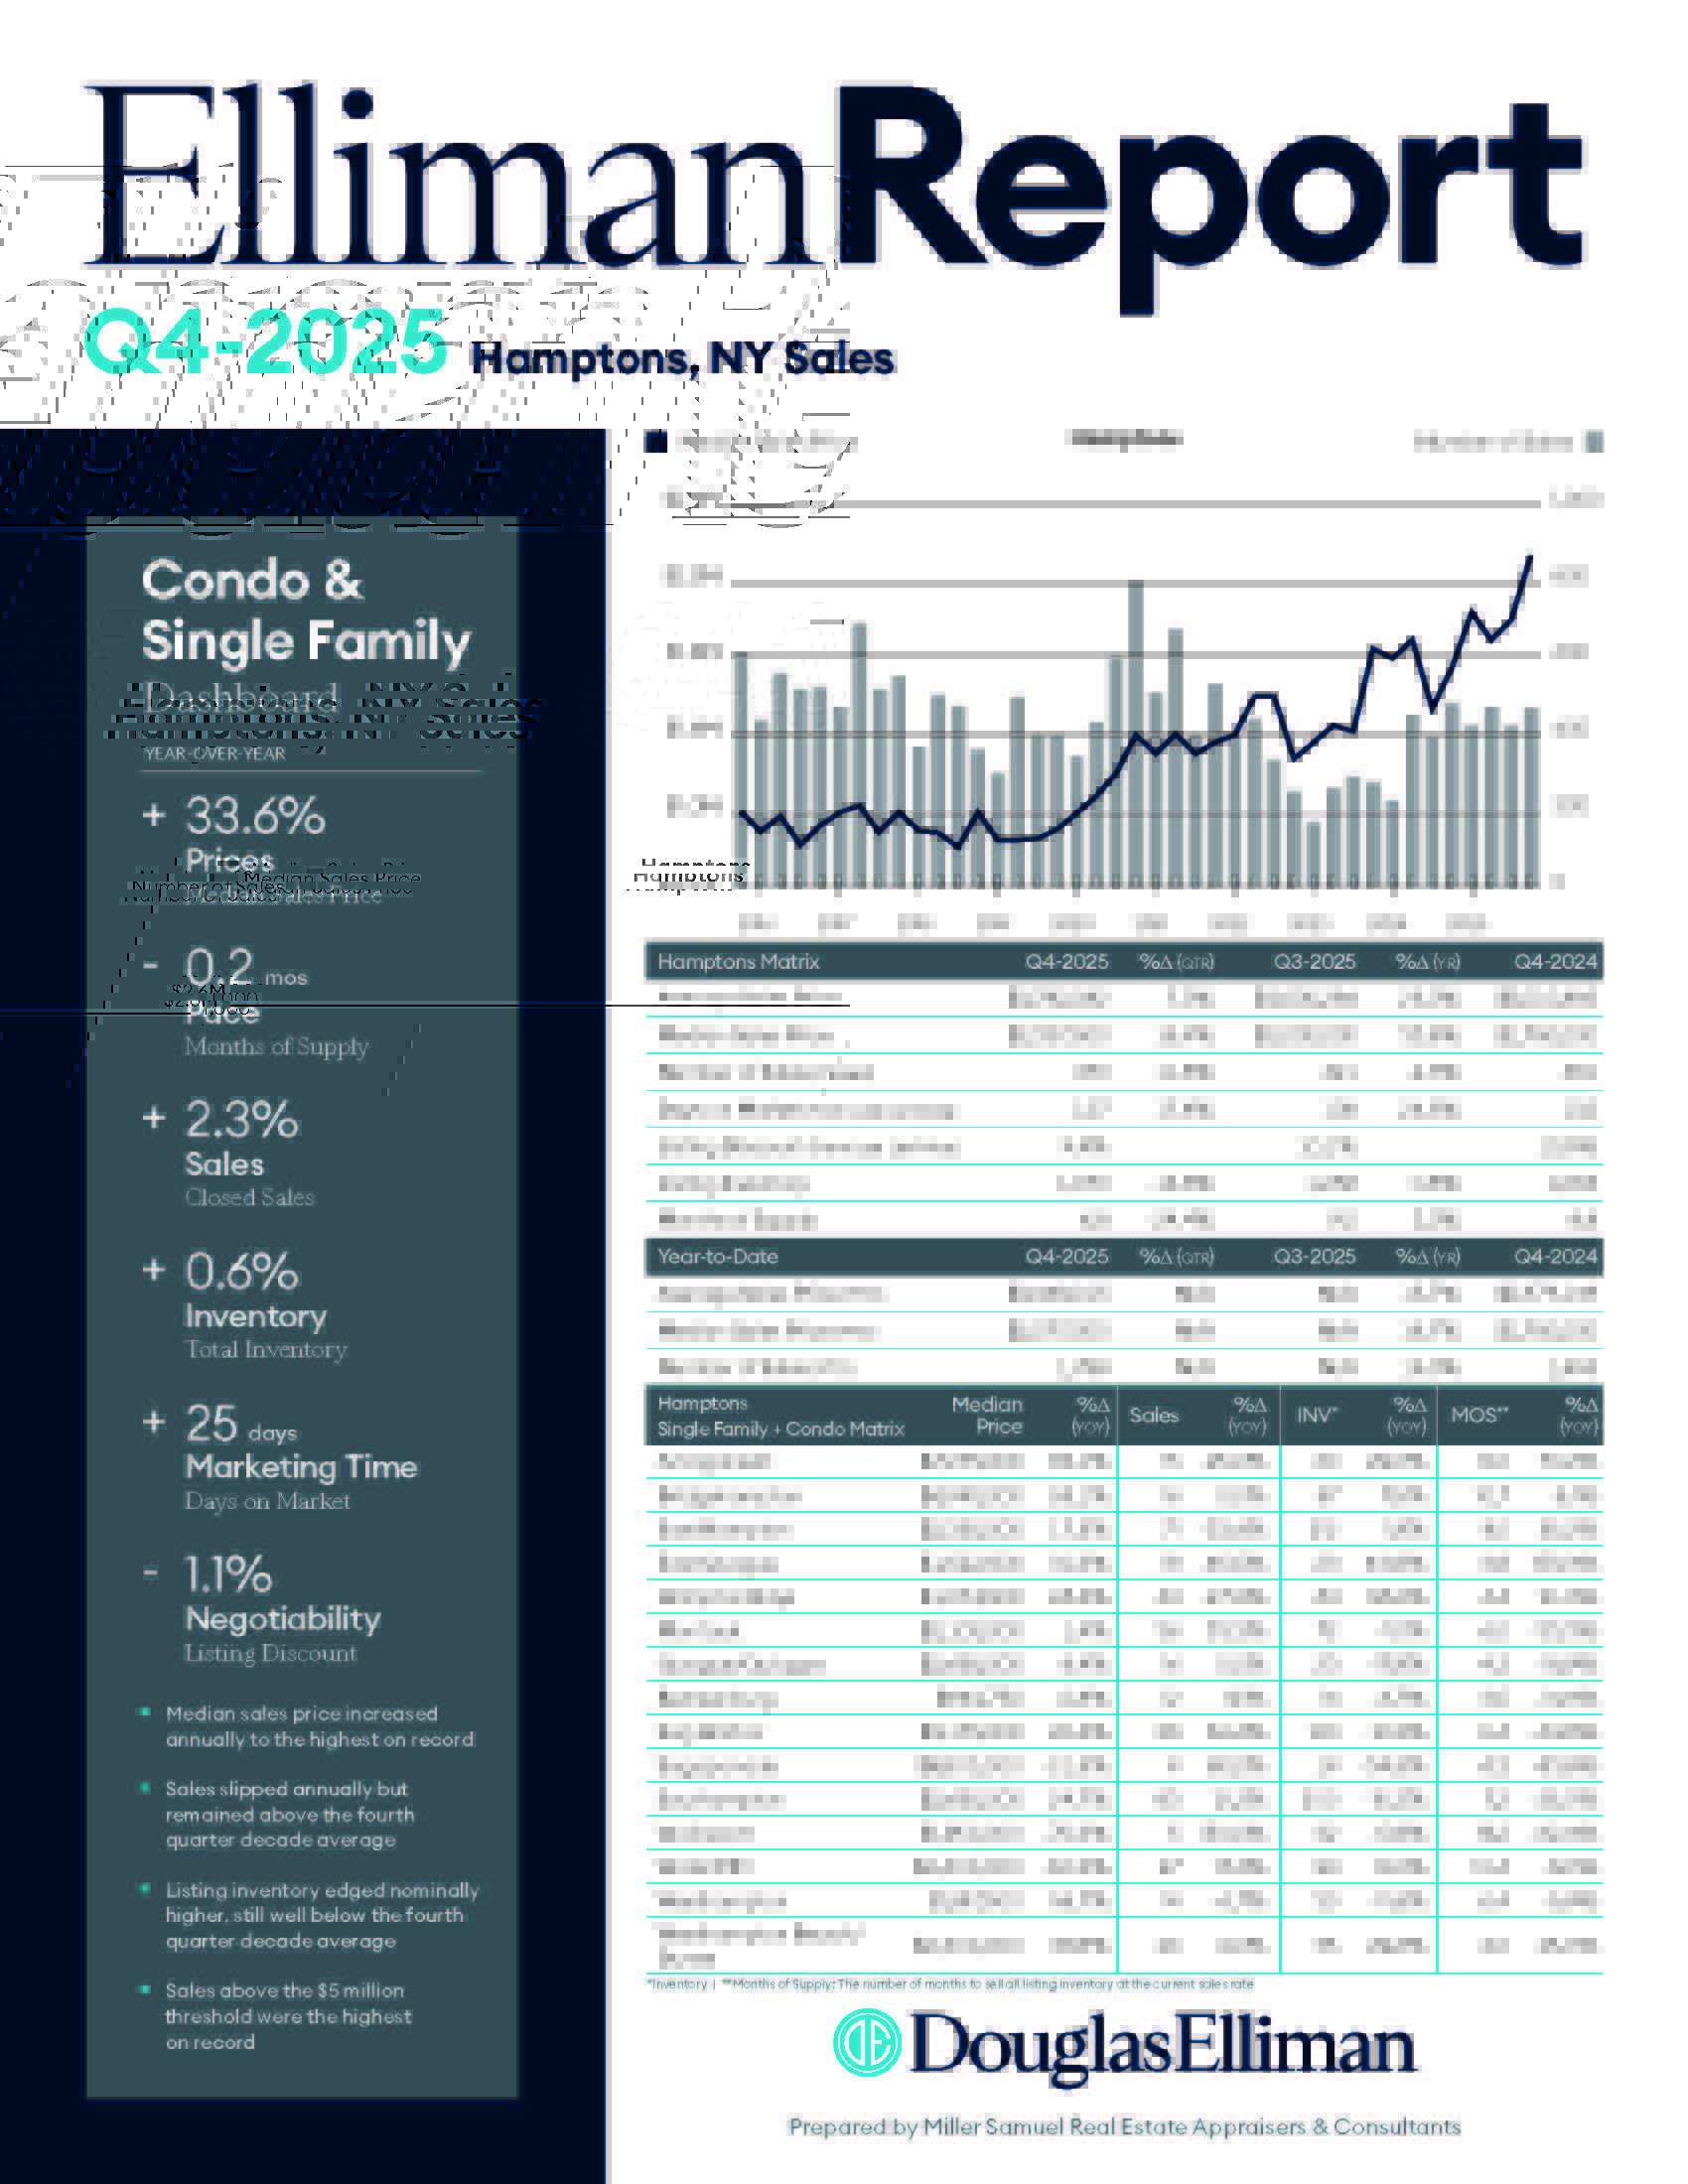
January 29, 2026
Elliman Report: Hamptons Sales 4Q 2025
read more
January 29, 2026
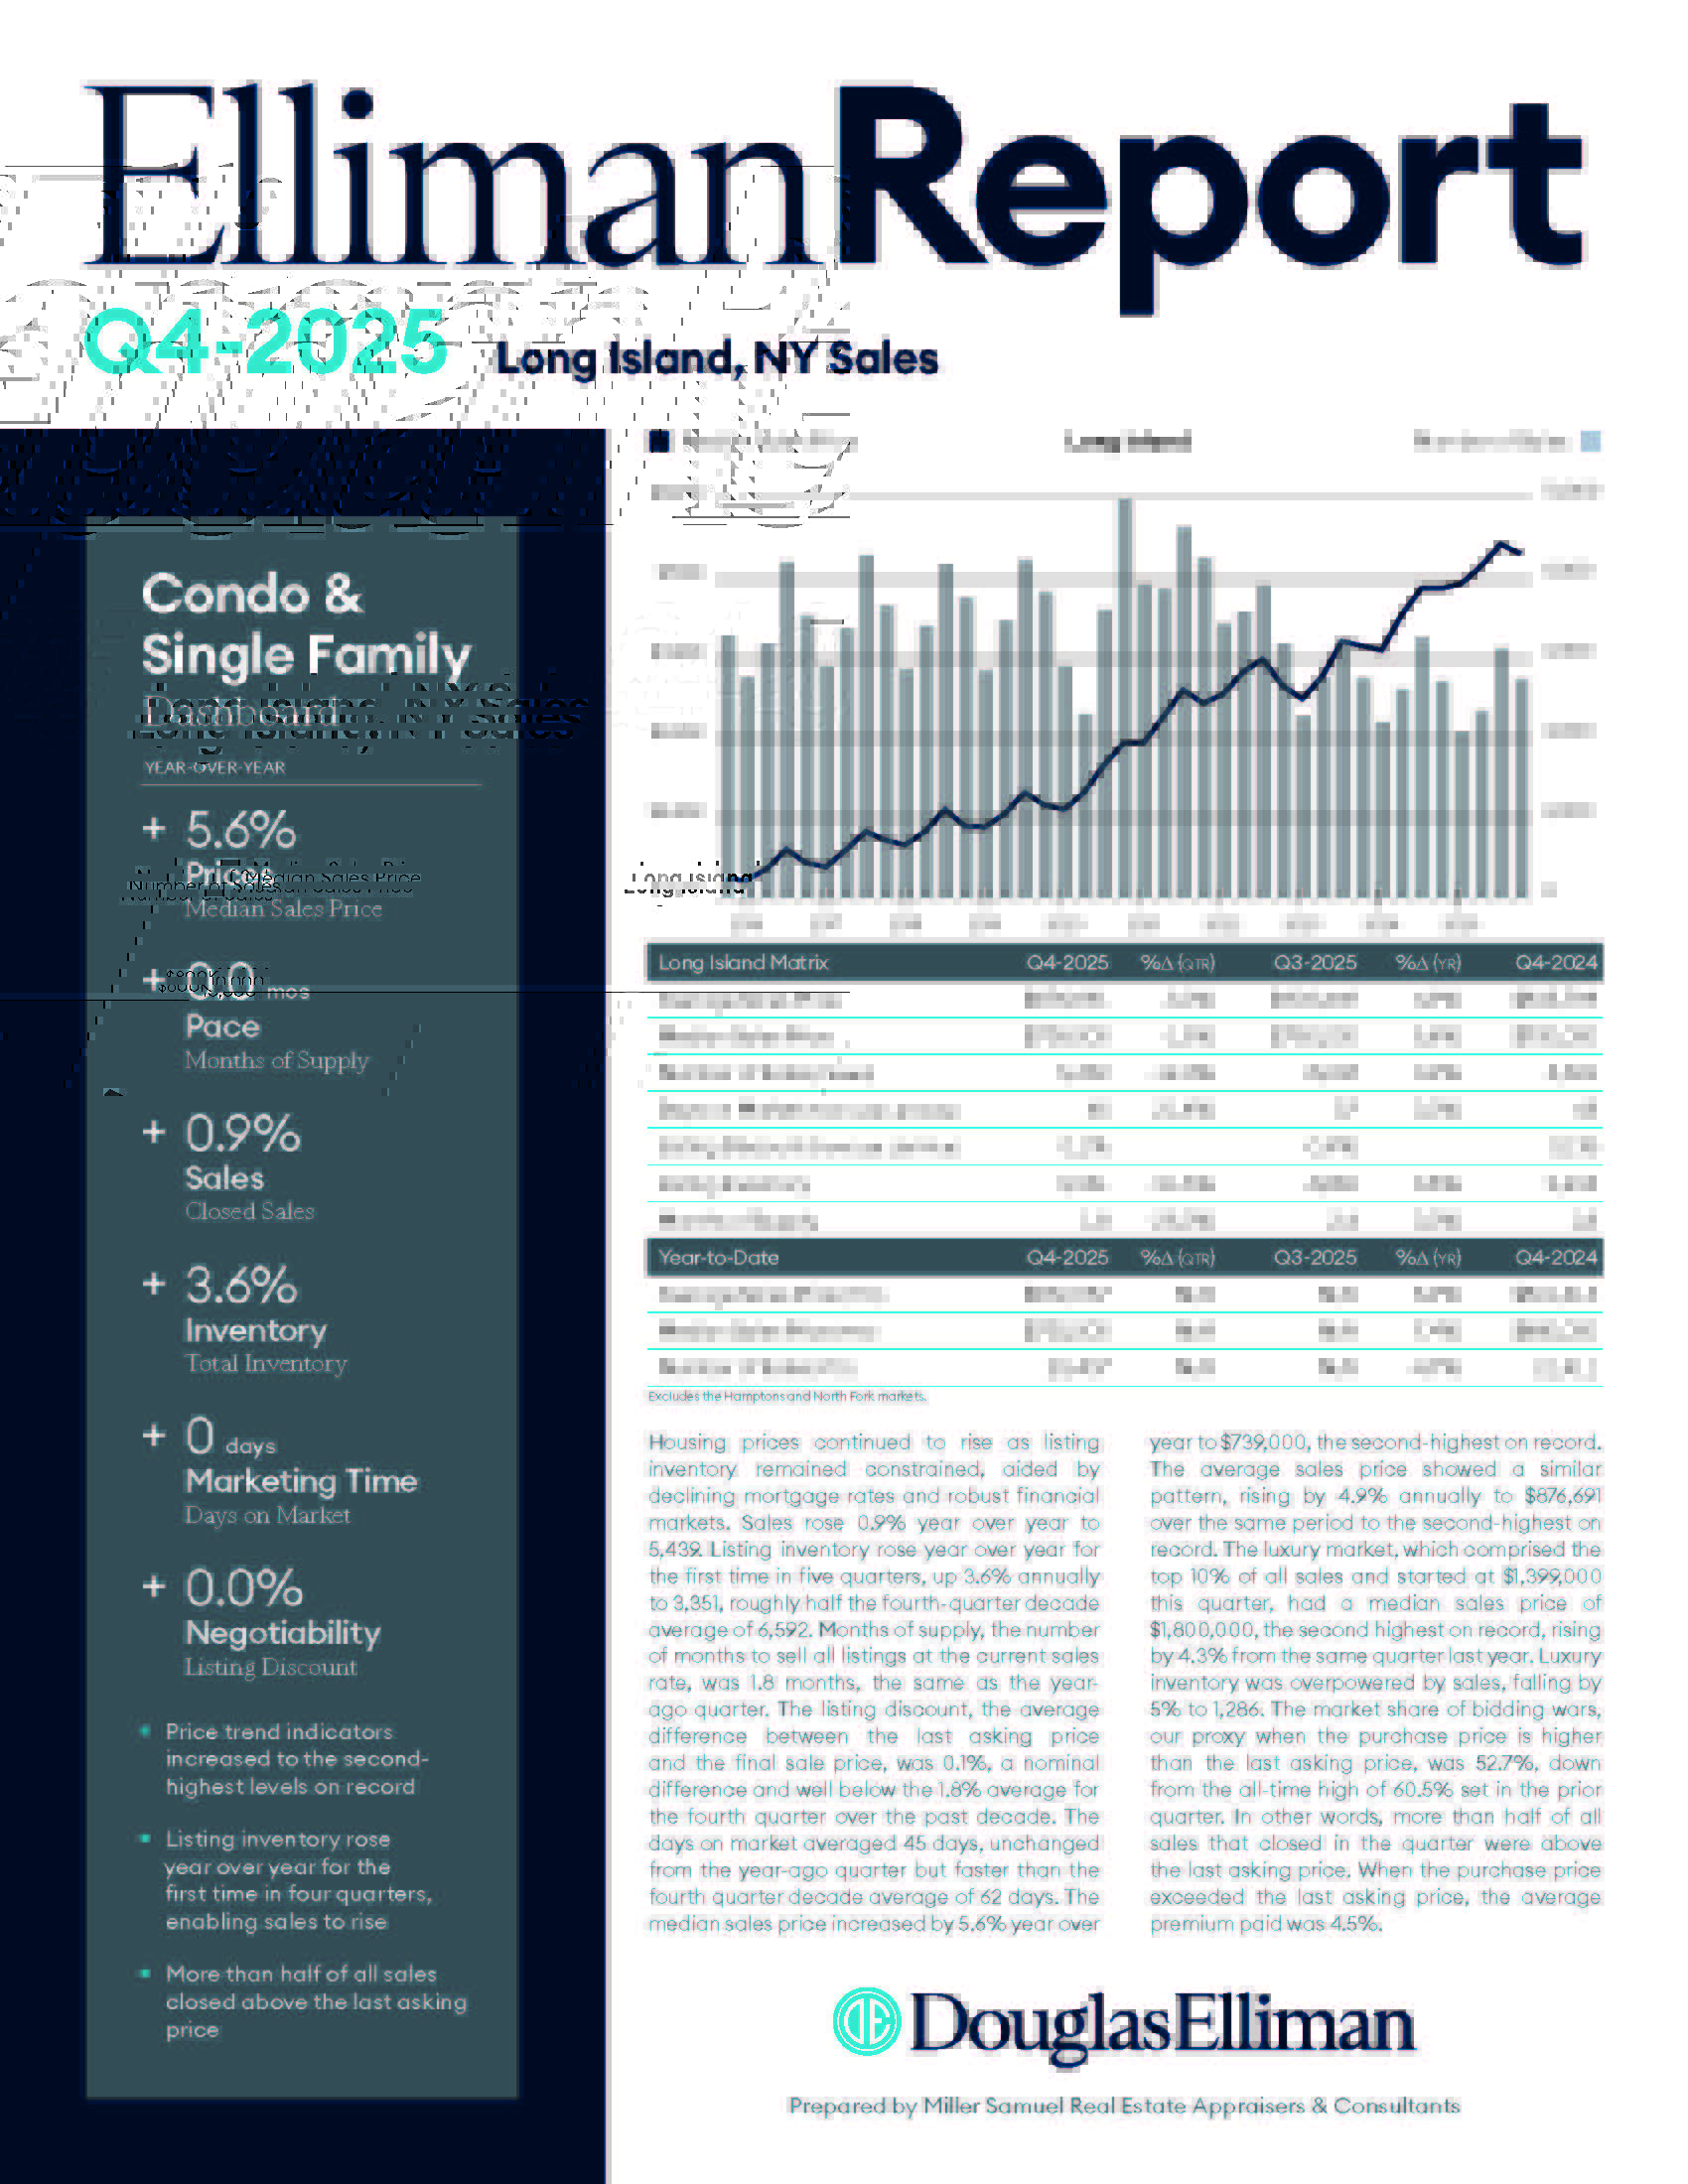
Elliman Report: Long Island Sales 4Q 2025
read more
January 29, 2026
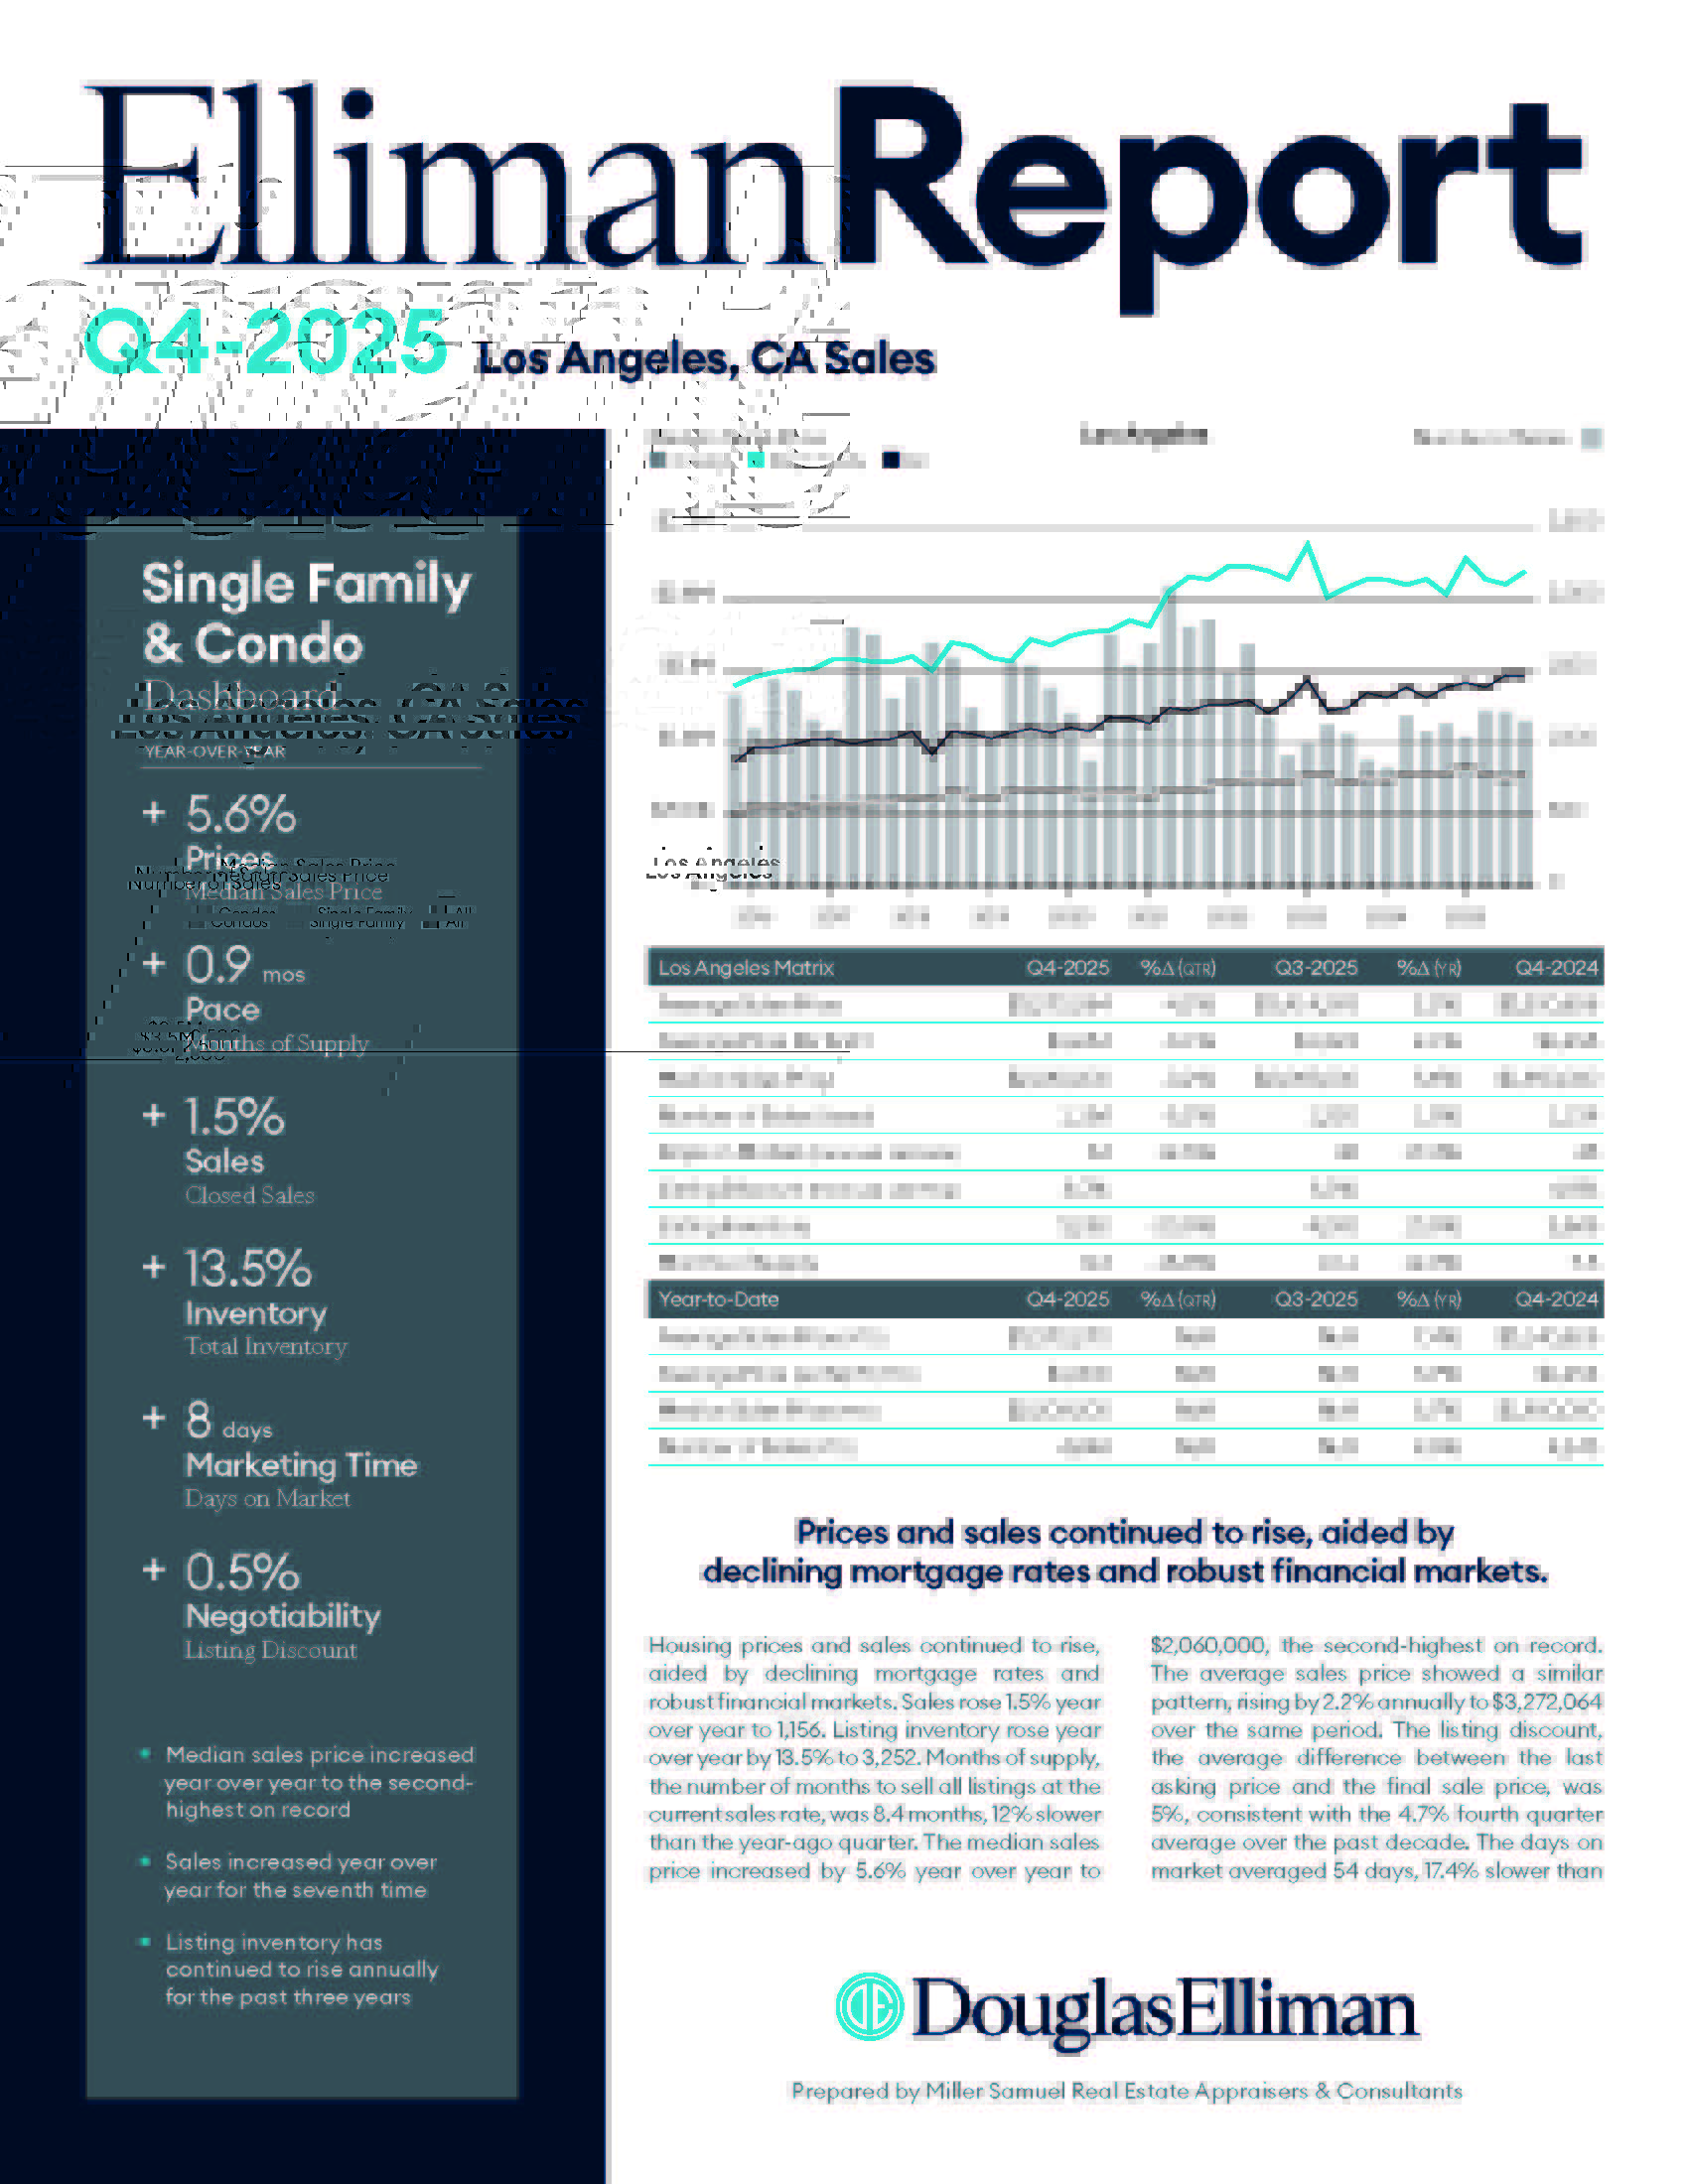
Elliman Report: Los Angeles Sales 4Q 2025
read more
January 29, 2026
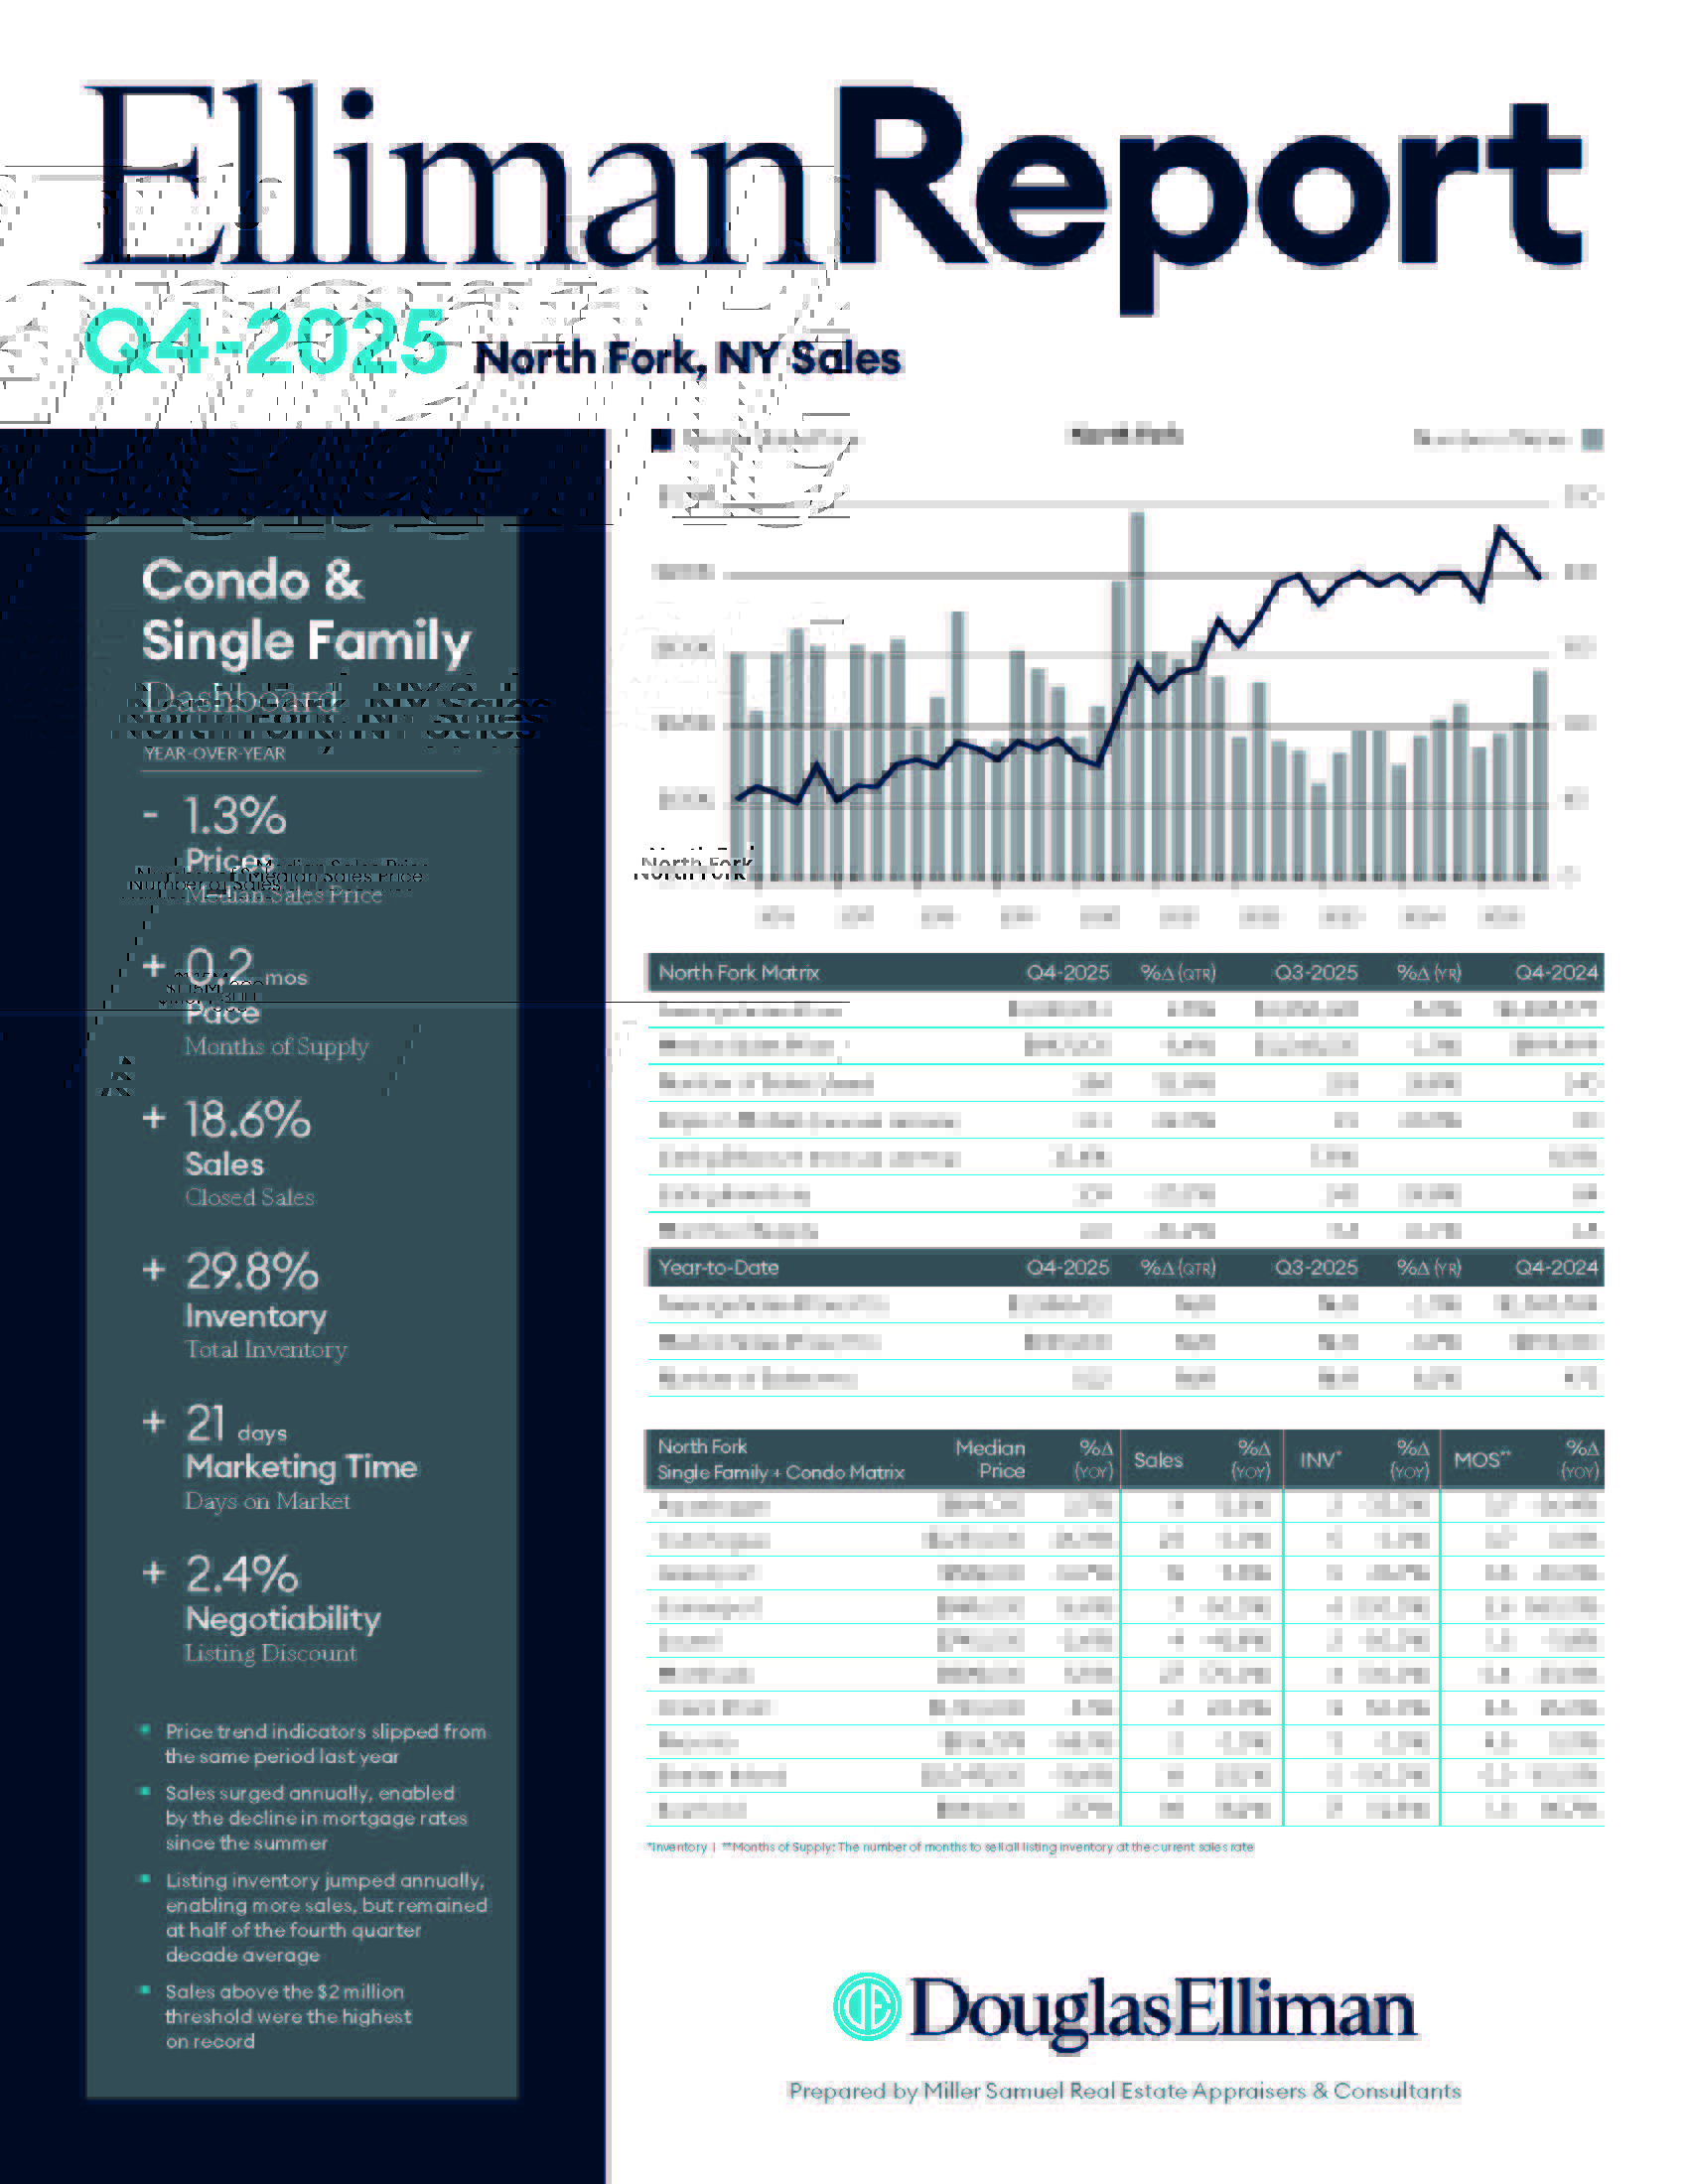
Elliman Report: North Fork Sales 4Q 2025
read more
January 29, 2026
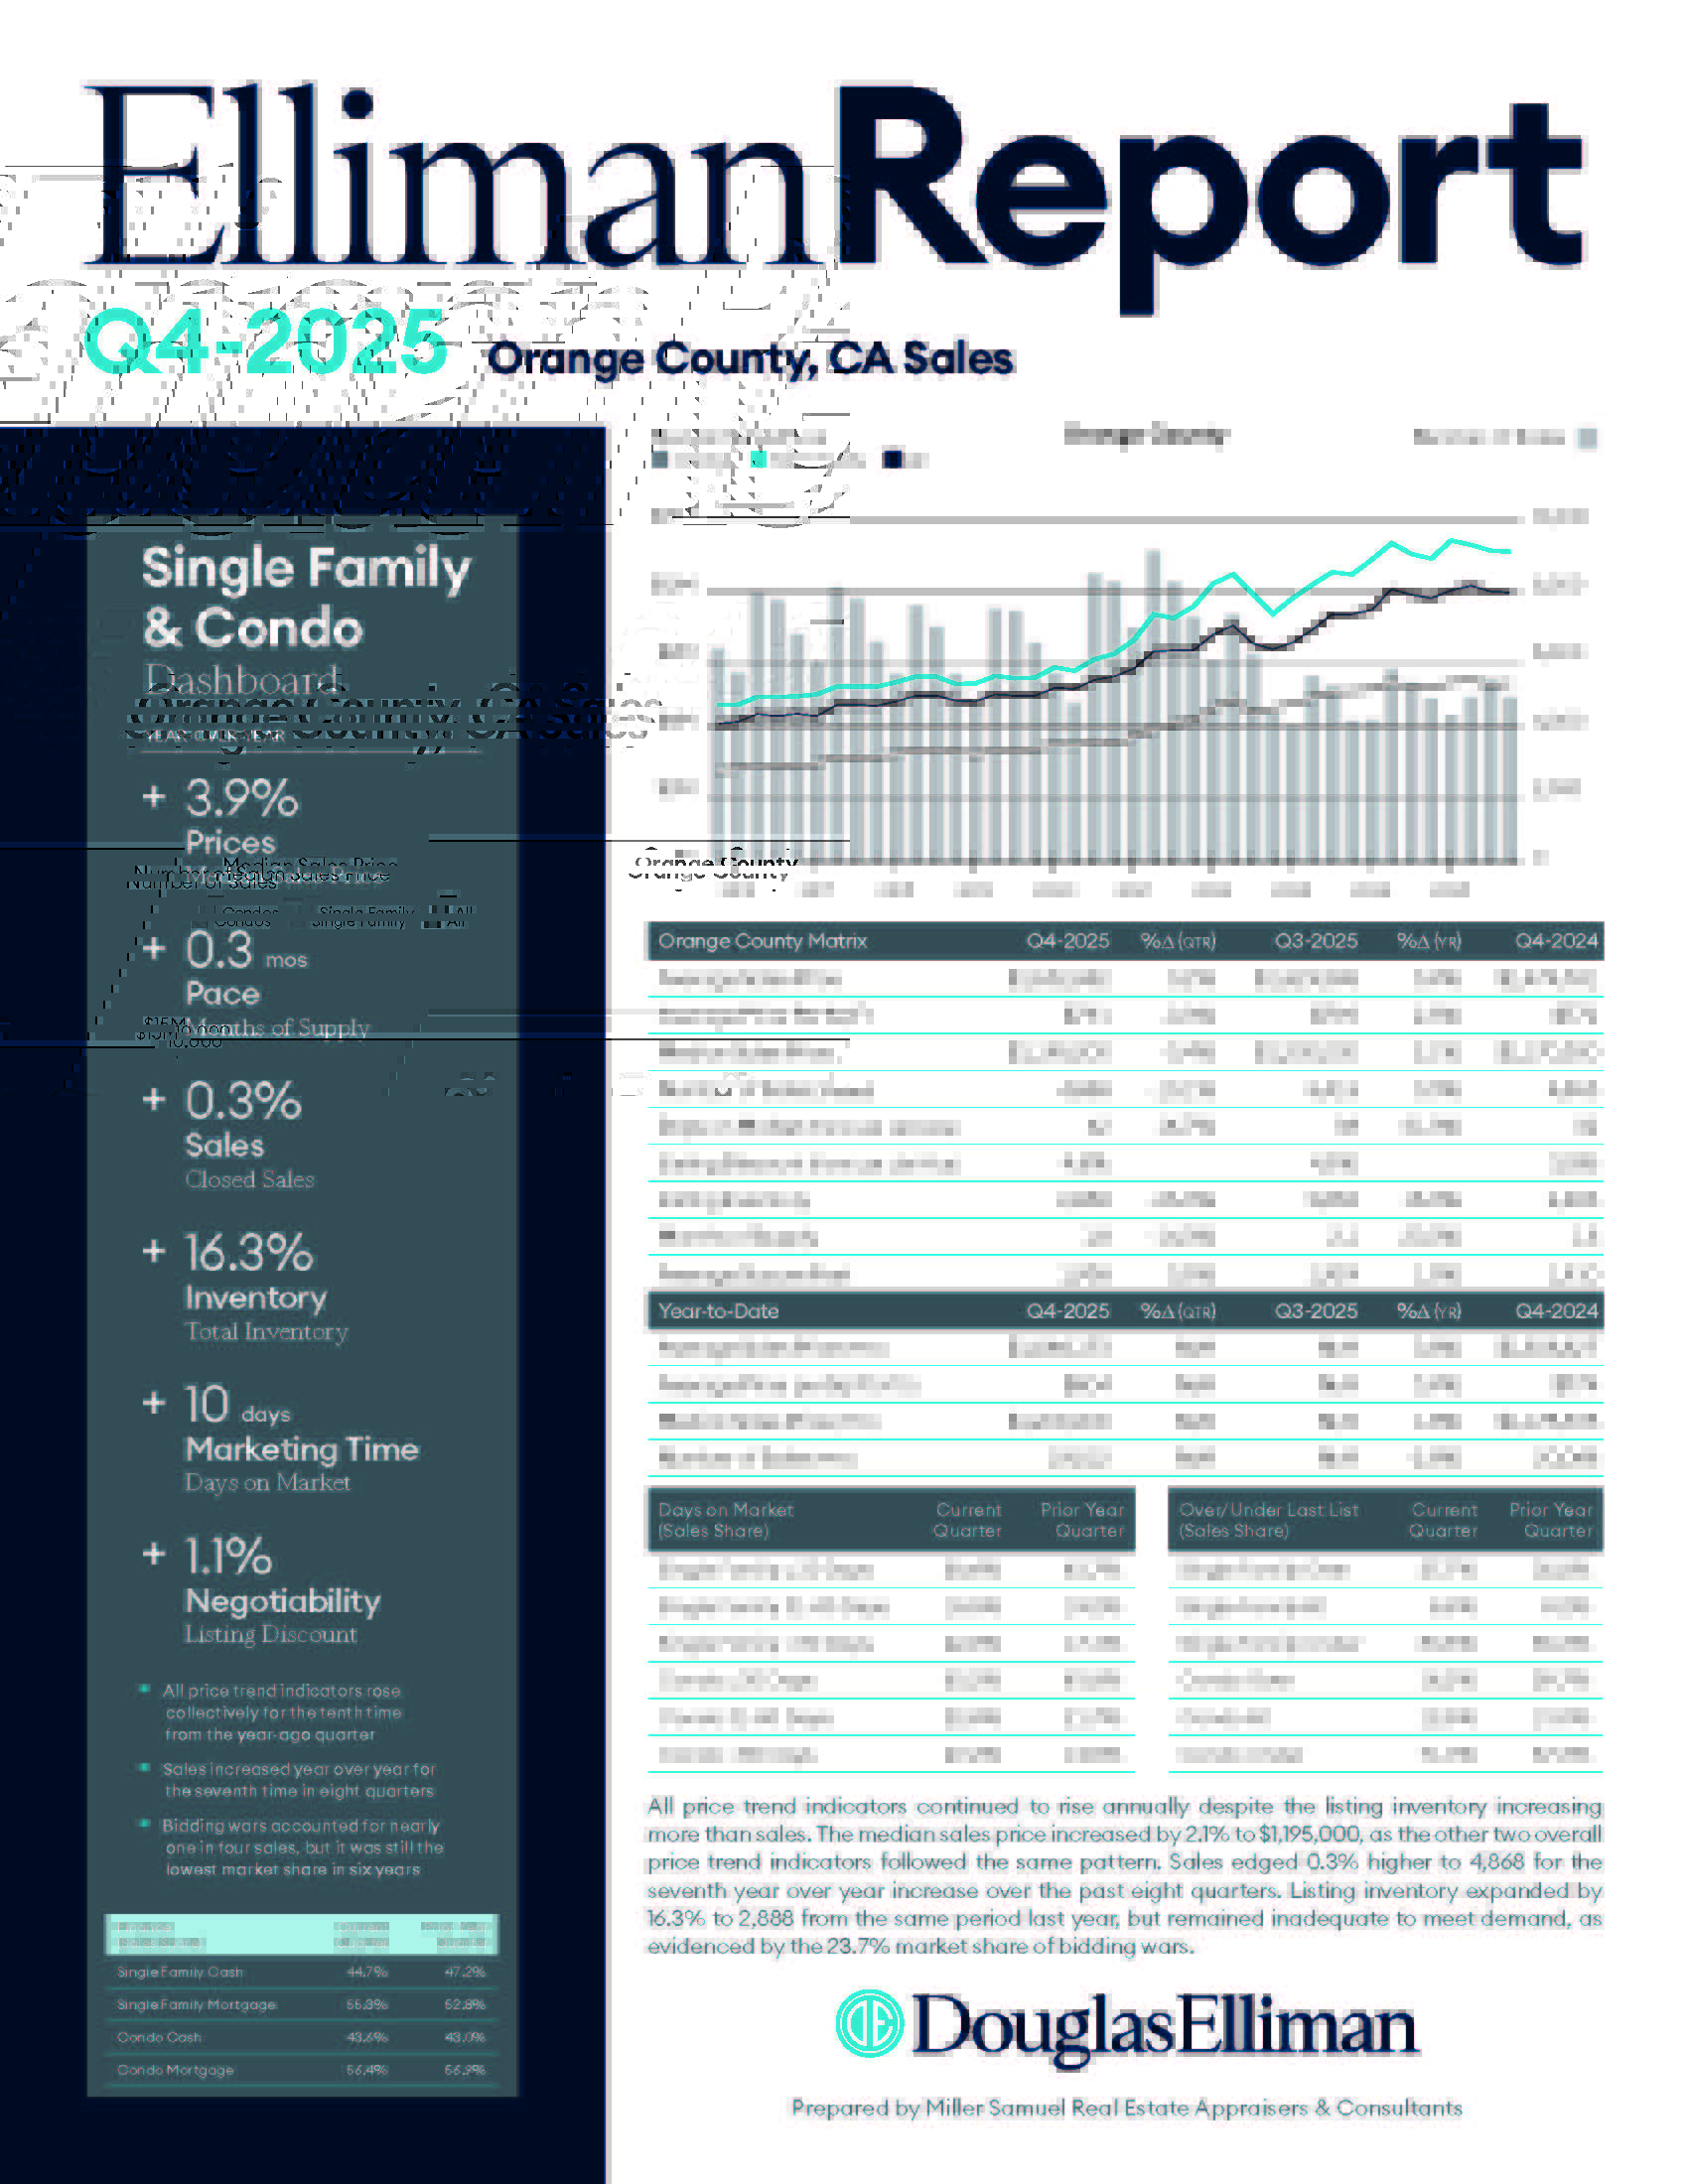
Elliman Report: Orange County Sales 4Q 2025
read more
January 22, 2026
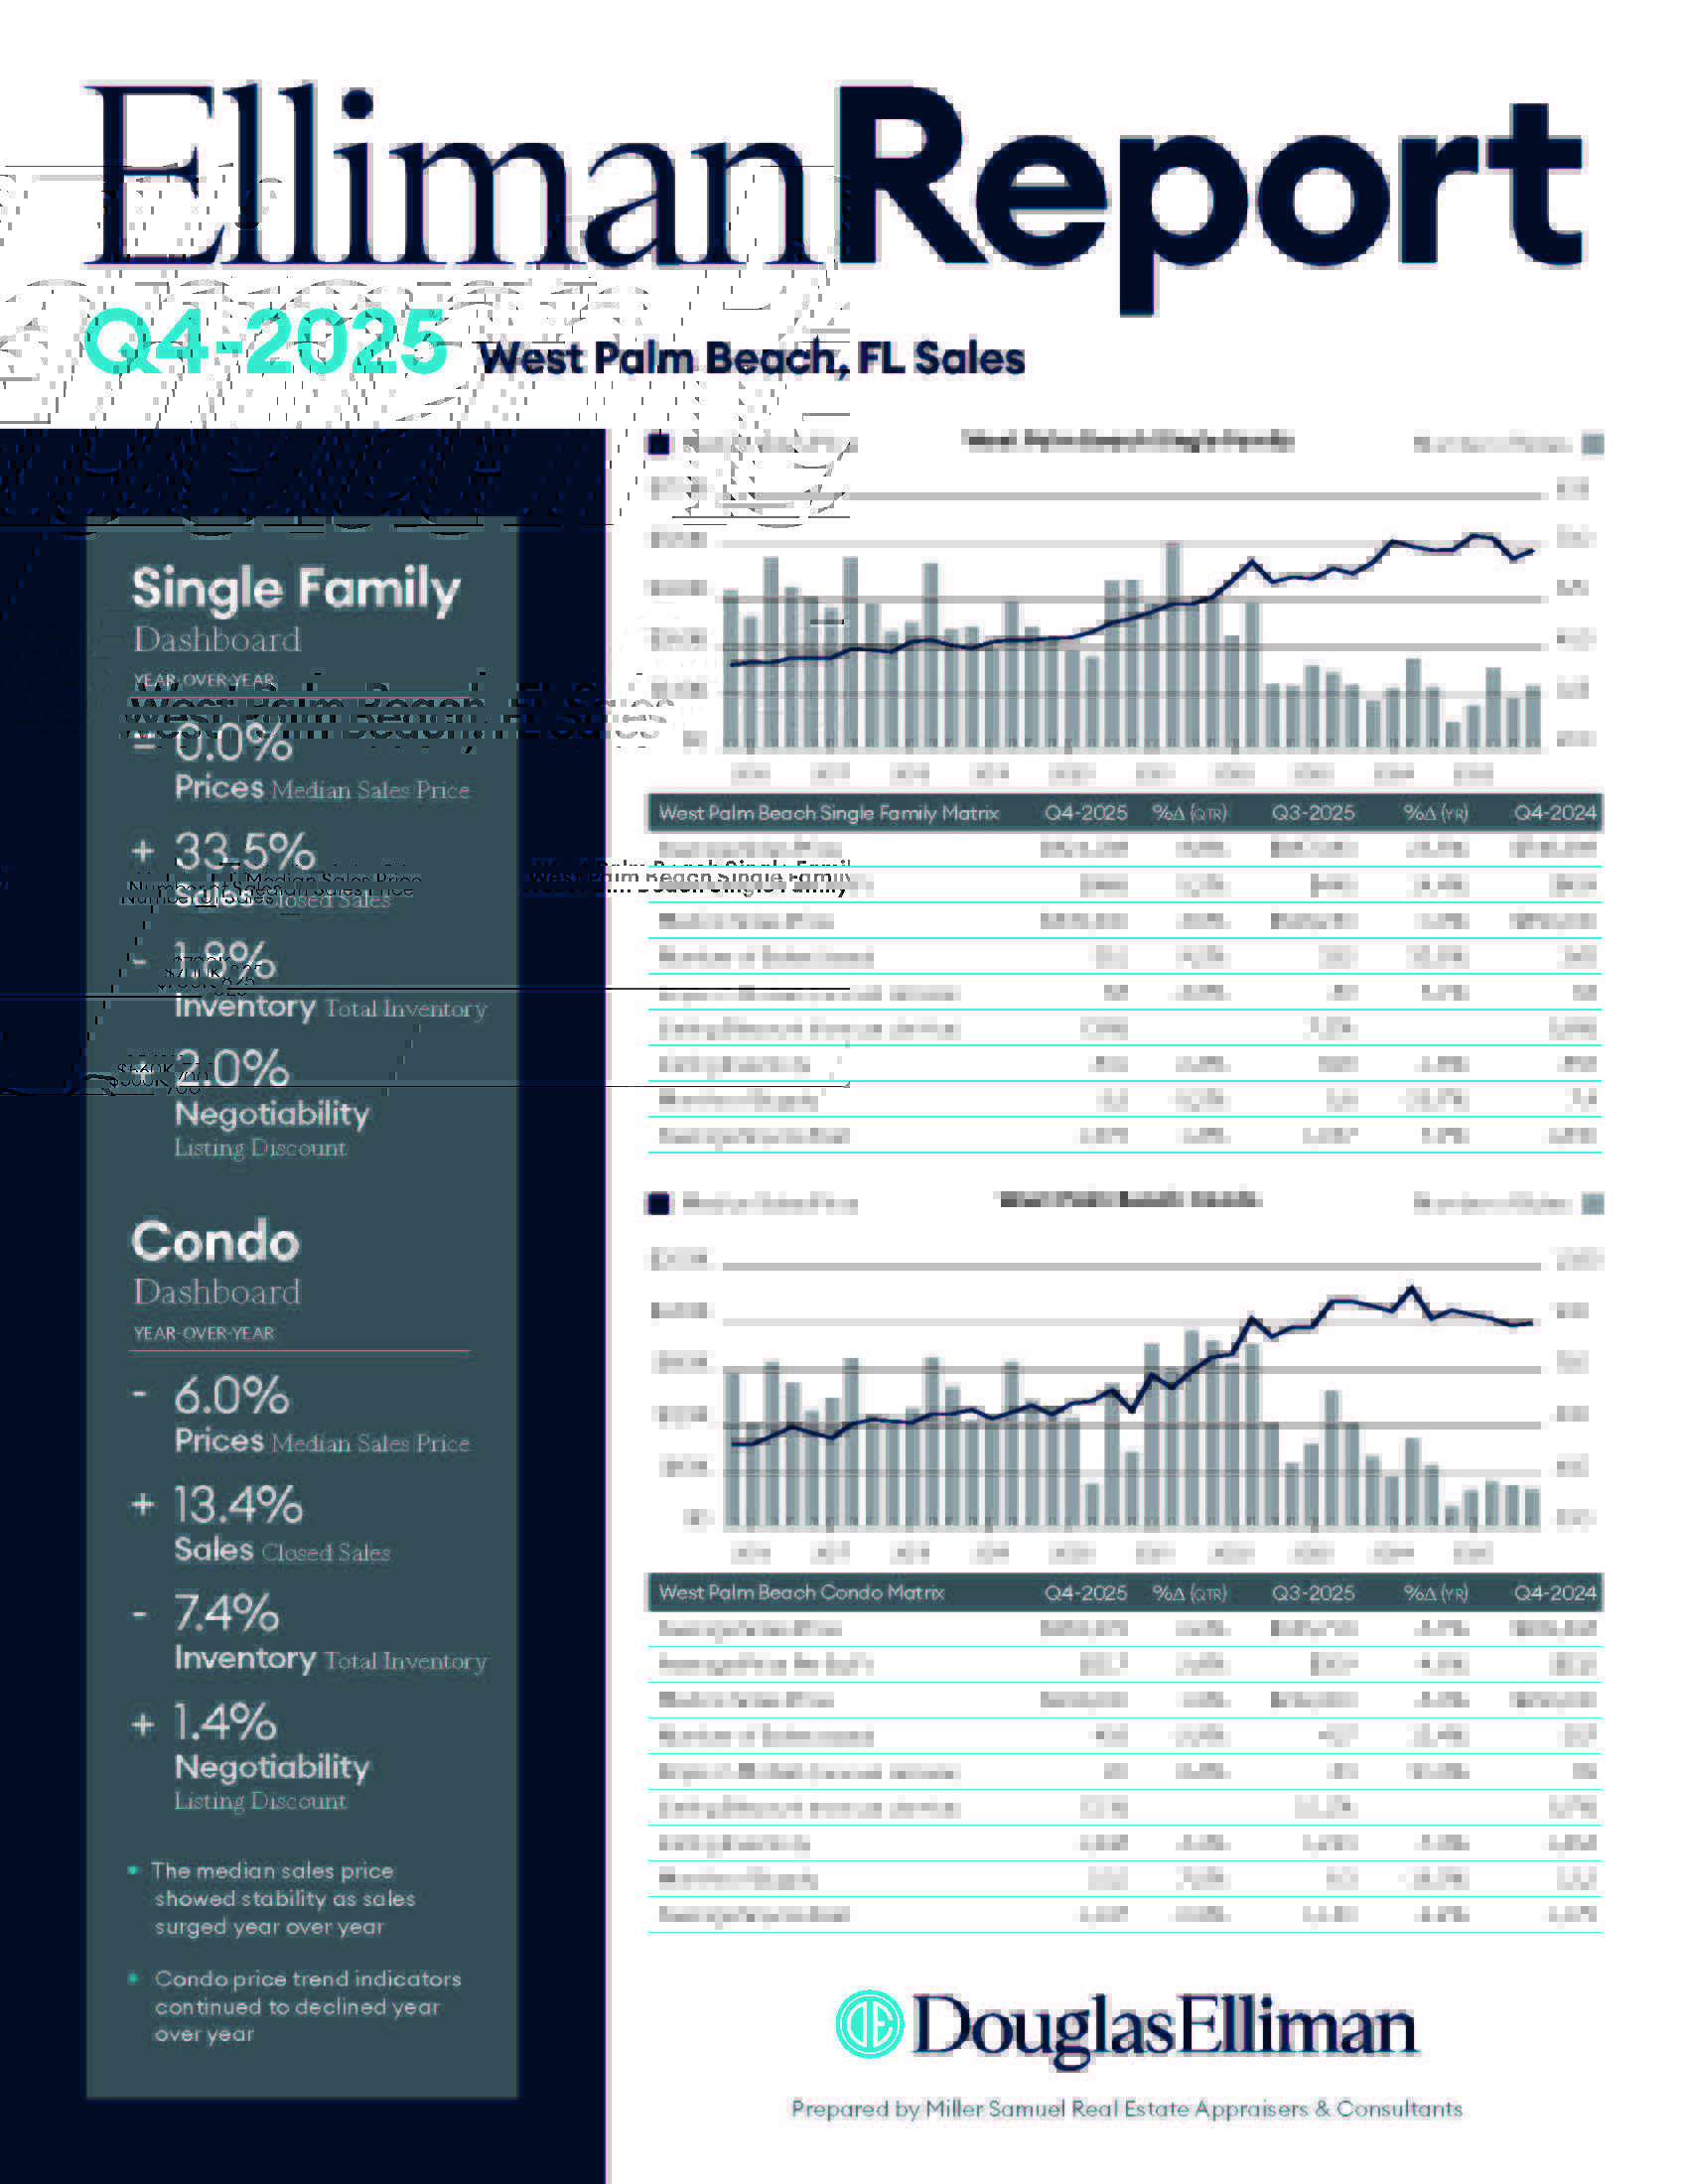
Elliman Report: West Palm Beach Sales 4Q 2025
read more
January 22, 2026
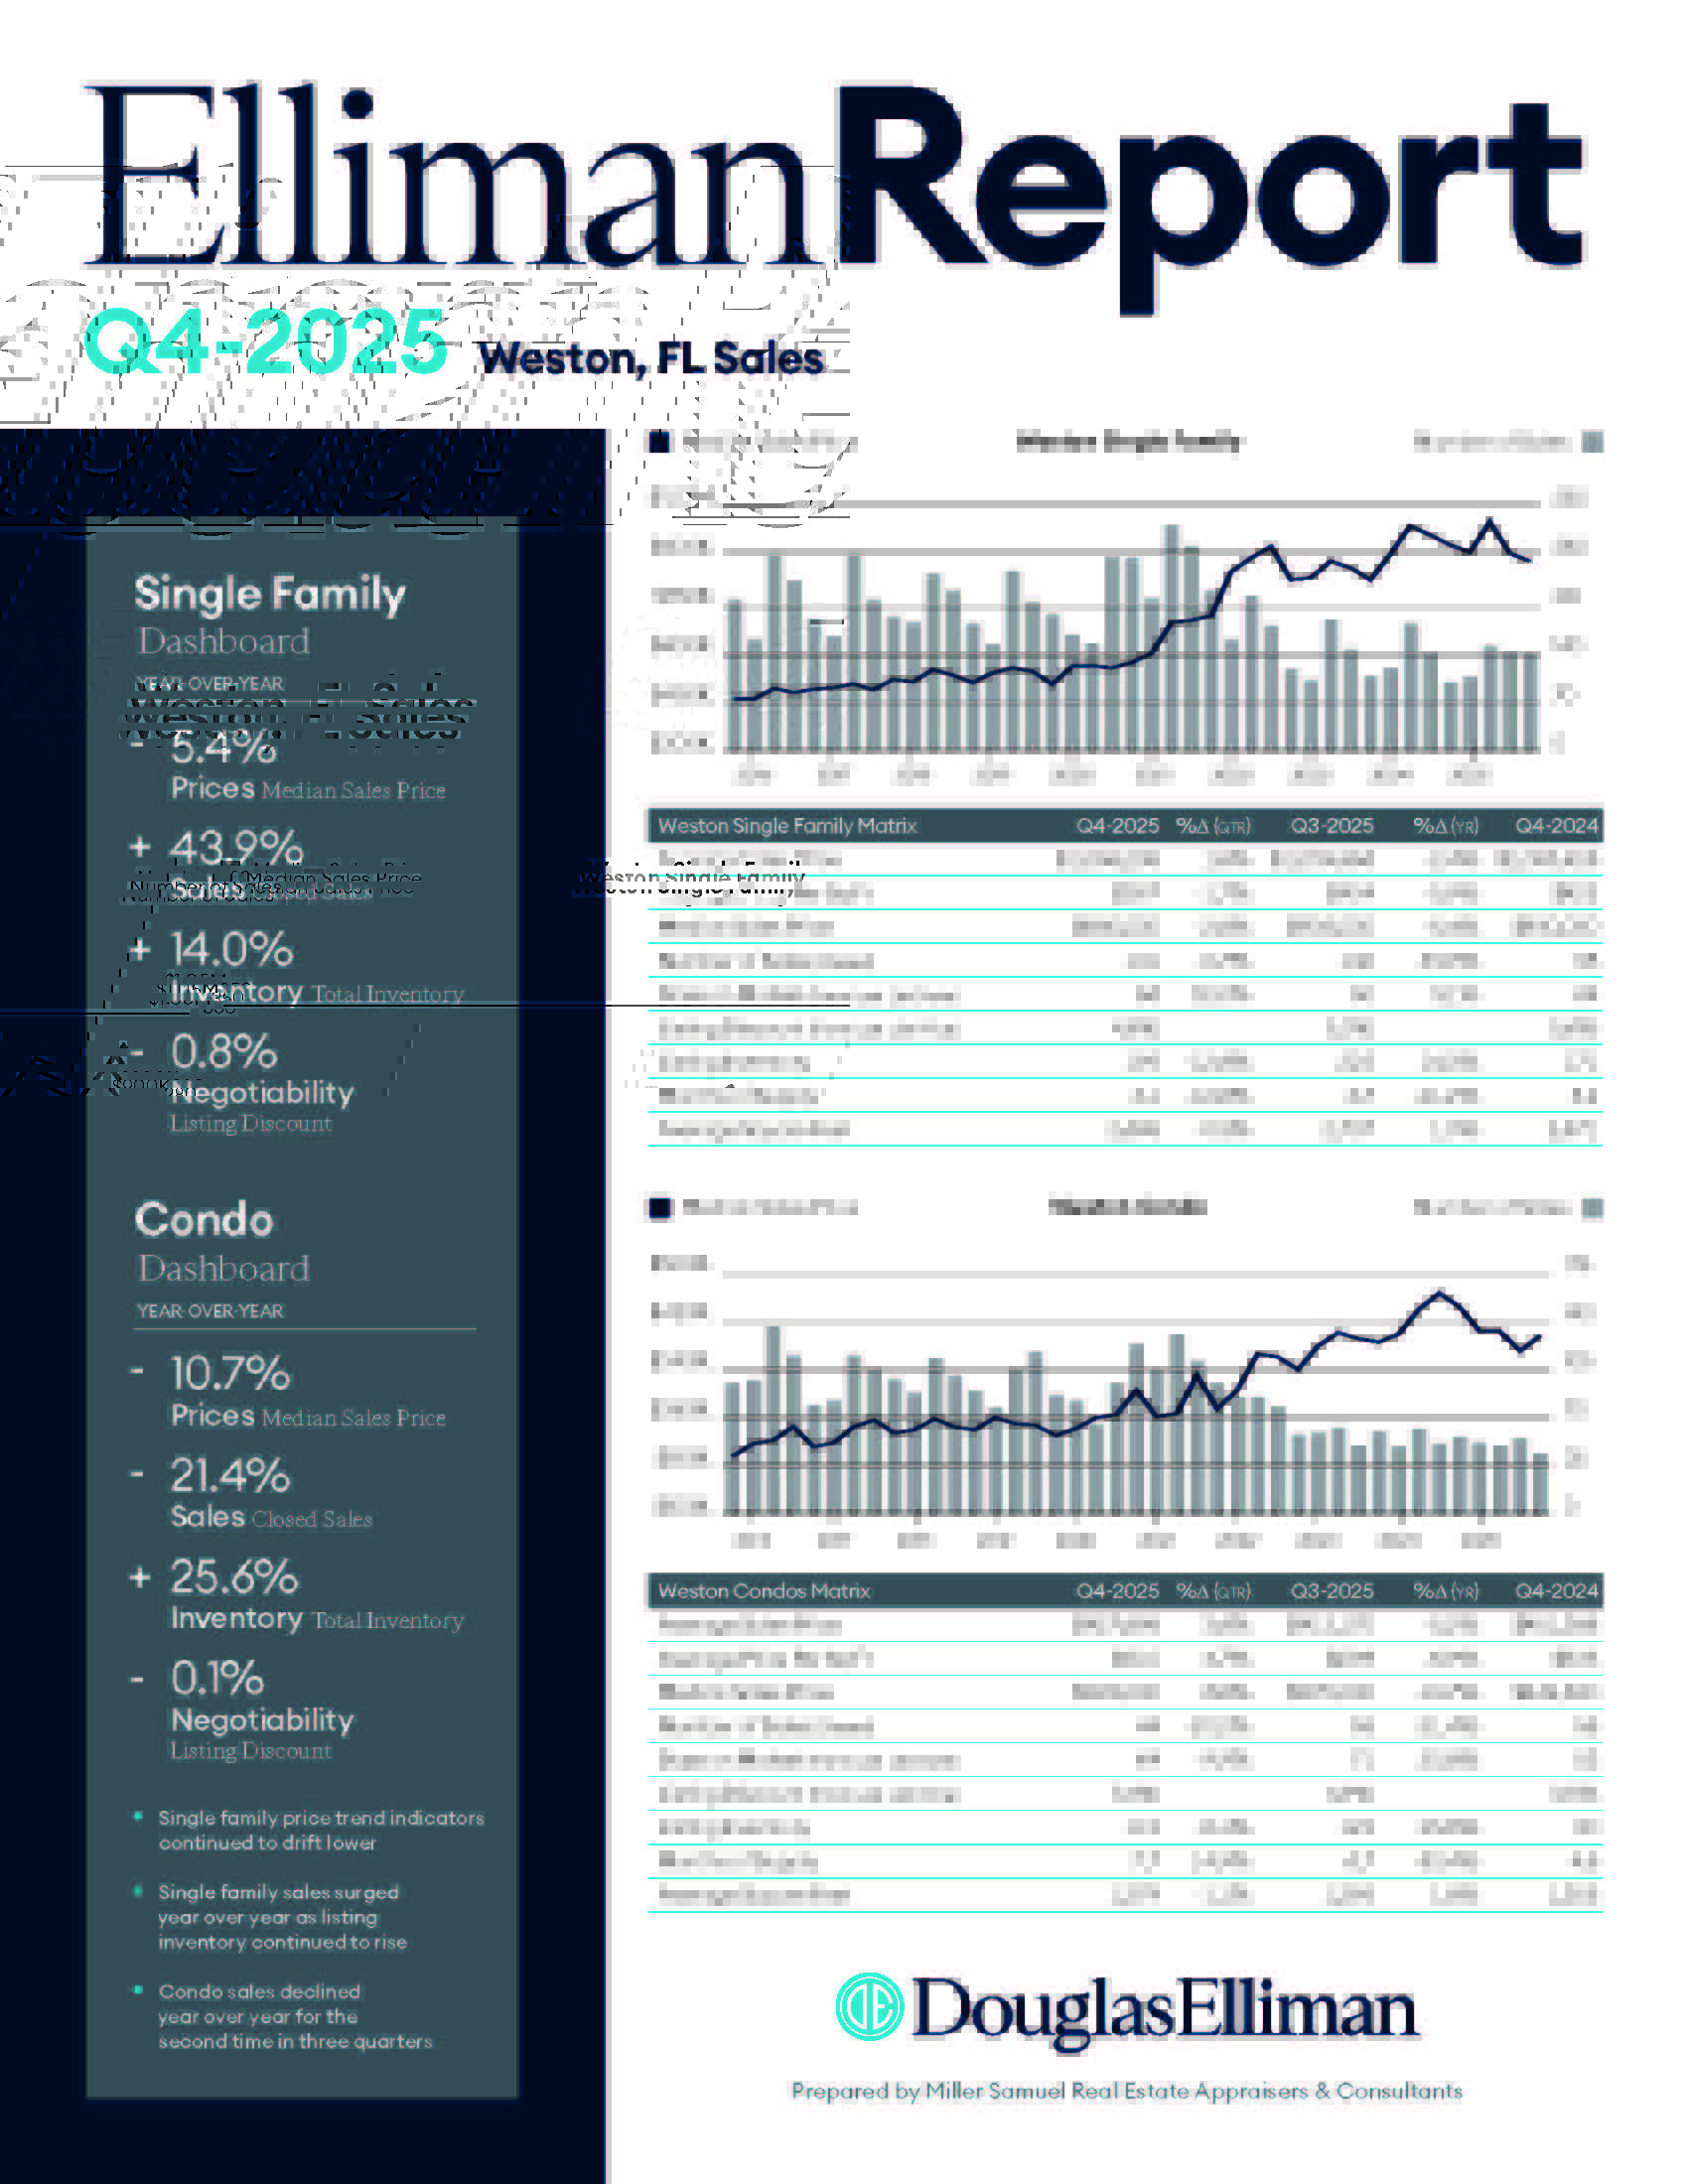
Elliman Report: Weston Sales 4Q 2025
read more
1
2
Next
Load More Market Reports
Page load link
Go to Top