If you’re a subscriber to the Bloomberg Terminals, as roughly 350,000 people are (paying $1,600+ per terminal per month), then you may already know there are a half dozen charts on the Manhattan luxury housing market. To be clear, these indices don’t suggest that housing price trends should be presented as a stock ticker.
It’s a good thing too, since the thought of making real estate housing markets equate to stocks was inspired by, and then was crushed by, the housing boom-bubble-bust era 2003-2008.
Here’s why a stock ticker for real estate is a flawed (aka dumb) concept:
– A stock market moves in the context of nanoseconds rather than weeks or months.
– Contract data is not available market-wide and if it were, lags the market by several weeks.
– Closed data used in a ticker would lag the market by months.
– It implies instant liquidity for real estate holdings.
– Not all property types see high volume so their trends are extrapolated (and thus diluted).
– It teaches market participants that short term views on real estate holdings are the norm, the way a stock day trader views the market.
While a daily real estate index can be created with relative technical ease, it doesn’t mean it is a good idea. It infers a level of precision that doesn’t exist and an accuracy based on lagging data that is not understood by users.
Those who push the stock ticker idea either didn’t work through the last cycle in real estate, or they didn’t learn from the experience.
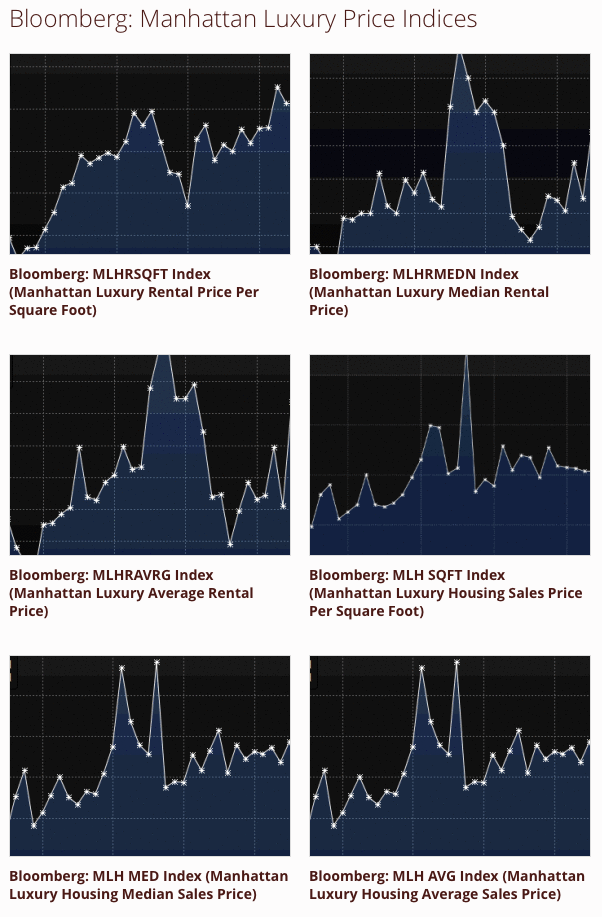
We update 3 charts on the Manhattan luxury sales market and 3 for the Manhattan luxury rental market. I have always defined “luxury” as the top 10% of transactions during a period.
Click on the gallery below to open each of the indices.