
Absorption defined for the purposes of this chart is: Number of months to sell all listing inventory at the annual pace of sales activity. (The definition of absorption in my market report series reflects the quarterly pace – nearly the same)
I started this analysis in August 2009 so I am able to show side-by side year-over-year comparisons. The blue line showing the 10-year quarterly average travels up and down because of the change in scale caused by some of the significant volatility seen at the upper end of the market. The “blue” line for average changes very little year to year but the scale of the chart does frequently.
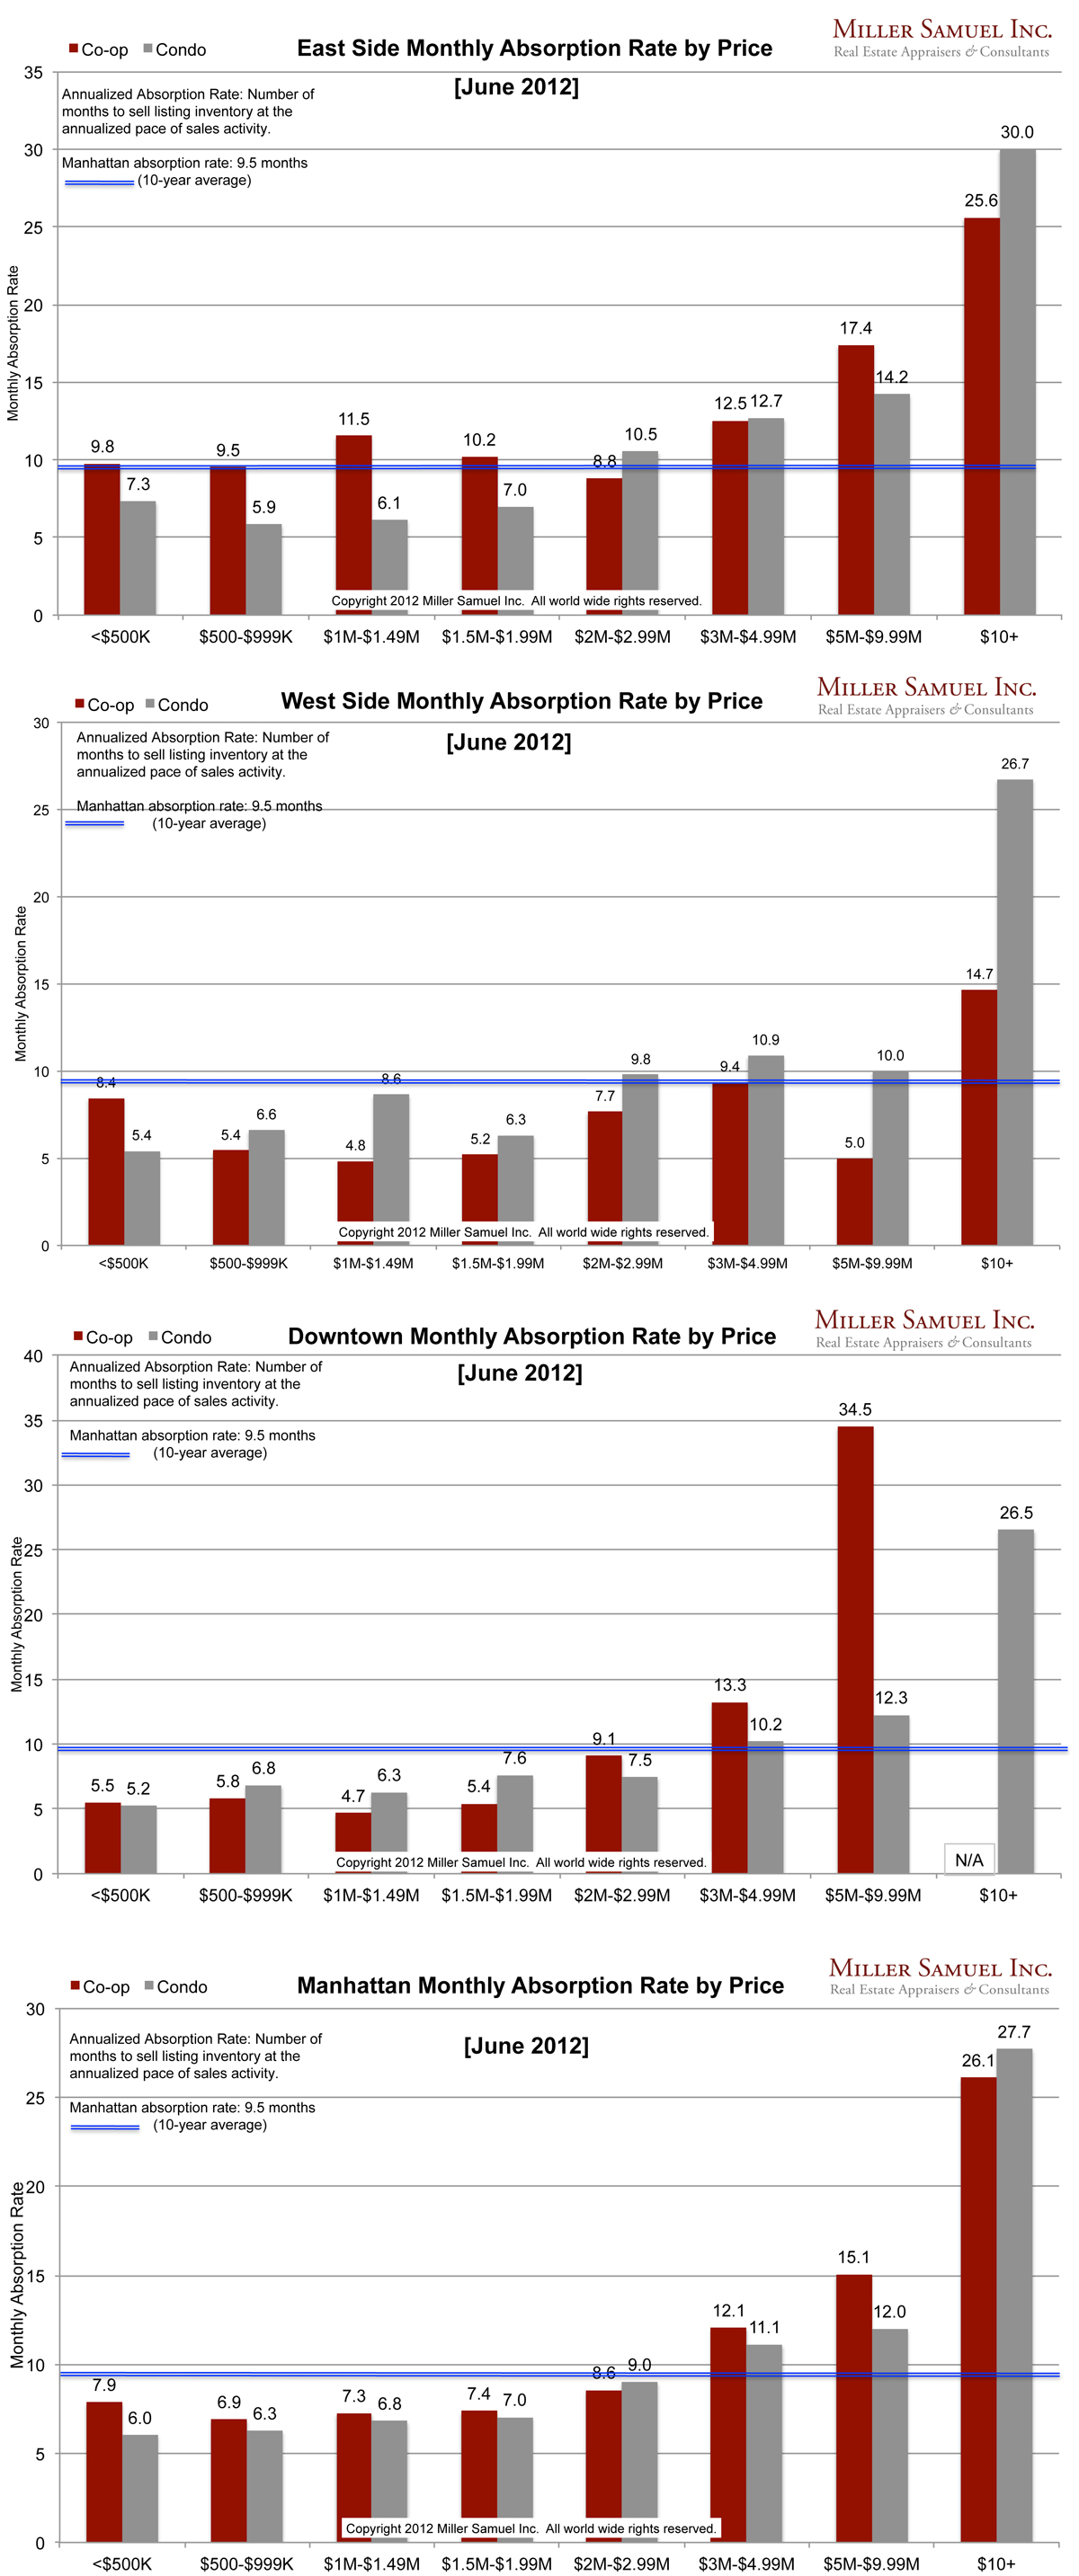
Side by side Manhattan regional comparison:

[click images to expand]
Thoughts on the year-over-year comparisons
* Manhattan All price segments below $3M experienced noticeable increases in pace of absorption – the lower the price segment that faster the pace.
* East Side Co-ops and condos being absorbed at a much faster pace than last year at this time.
* West Side Nearly all market segments continue to see faster absorption with sub-$500k and $2M to $10M seeing significant improvement.
* Downtown Sub-$2M now seeing absorption rates as low as 5 months, well the 9.5 month 10-year average.
Note: This chart series does not include shadow inventory (properties ready for market but not yet listed for sale) so this analysis somewhat understates the pace of condo absorption. The Uptown (Northern Manhattan) data set is too thin for a reliable presentation.
_______________________
Manhattan Market Absorption Charts 2012 [Miller Samuel] Manhattan Market Absorption Charts 2011 [Miller Samuel]
6 Comments
Comments are closed.
[…] Absorption defined for the purposes of this chart is: Number of months to sell all listing inventory at the annual pace of sales activity. (The definition of absorption in my market report series reflects the quarterly pace – nearly the… Read More […]
Johnathan,
I’ve heard admonishment for presenting absorption as listings/sales or vice versa. The critics insist the endeavor absolutely requires including demographics such as net migration and economics such as employment. Obviously the trouble with the “purist” viewpoint is that it is incredibly expensive and time consuming to execute.
So, how do you maintain credibility without satisfying the establishment critics or have you now become THE establishment?
There is a huge difference between measuring macro absorption of a sub-market using 2 metrics and an absorption study designed for a developer or institution to know what type of unit mix to create in a specific building. They are not the same thing AT ALL. One is property specific and one is top level.
A silly admonishment. Hope you came to the victim’s defense. 😉
Unfortunately I simply hung my head and wrung my hands in despair because until just now I was ignorant. I confess to feeling safe since they weren’t after me. I am a victim of the babble we appraisers use in place of technical language. Interpretation of fractured semantics is not my long suit, but I do know how to use ignorance and “poor me” as defenses.
Thanks for the explanation. I’ll try it on the next MAI I meet. Or maybe I should just listen and think.
You’re too hard on yourself 😉
Kudos Jonathan,
You have enhanced my competency, it was free and I didn’t even have to join something to get it.
Keep up the good work and works for our profession.