 [click to expand]
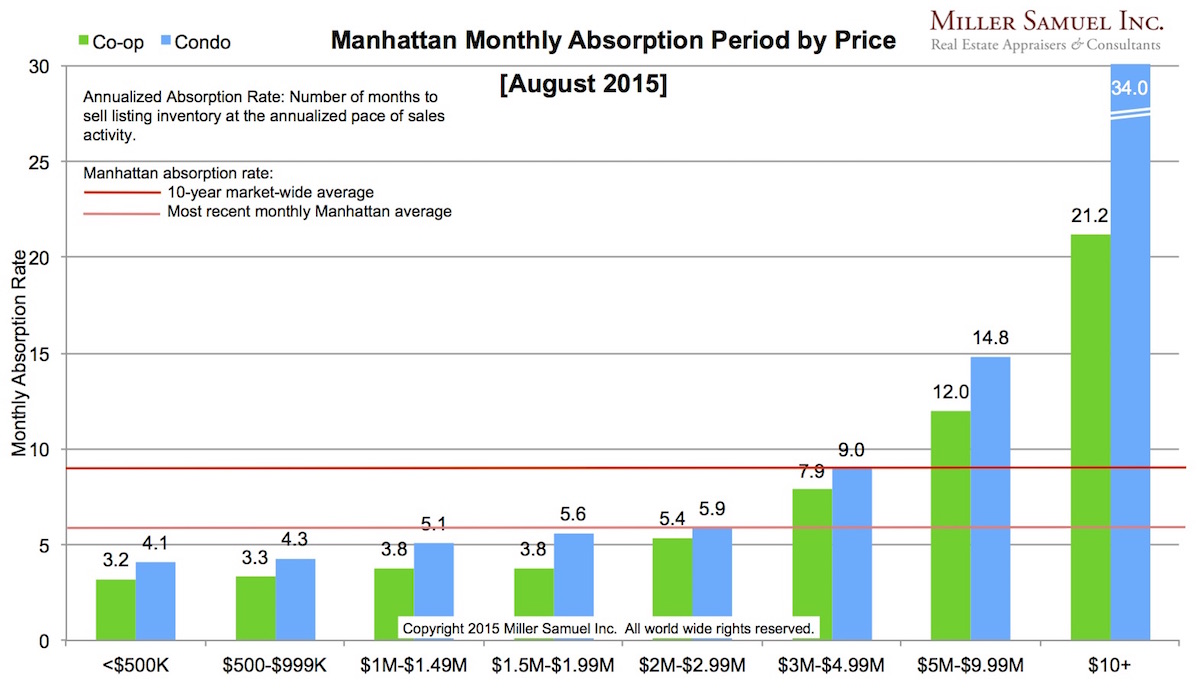
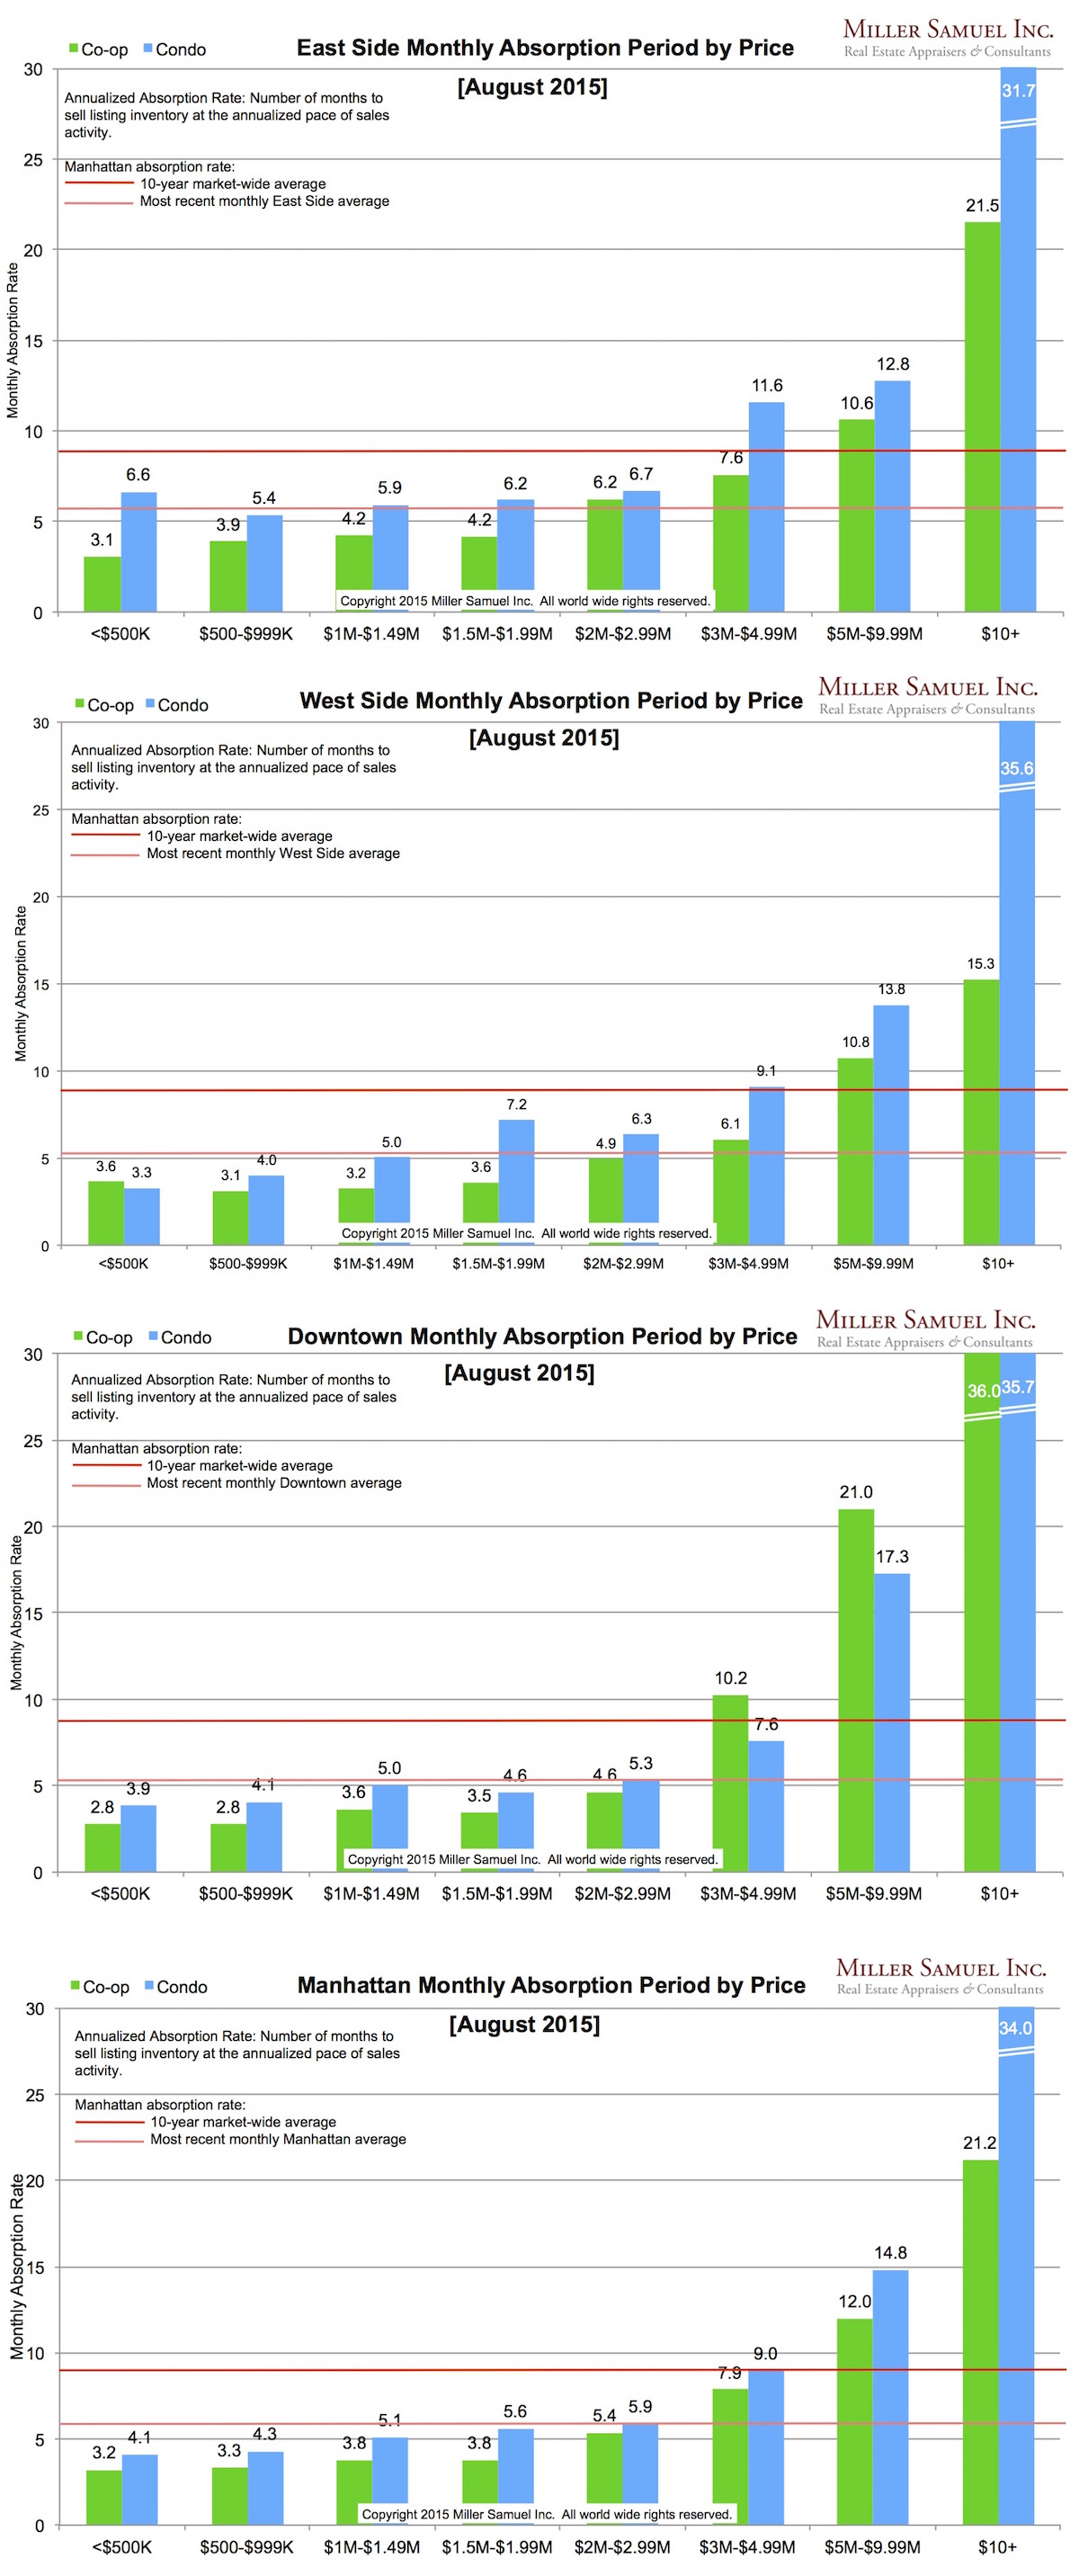
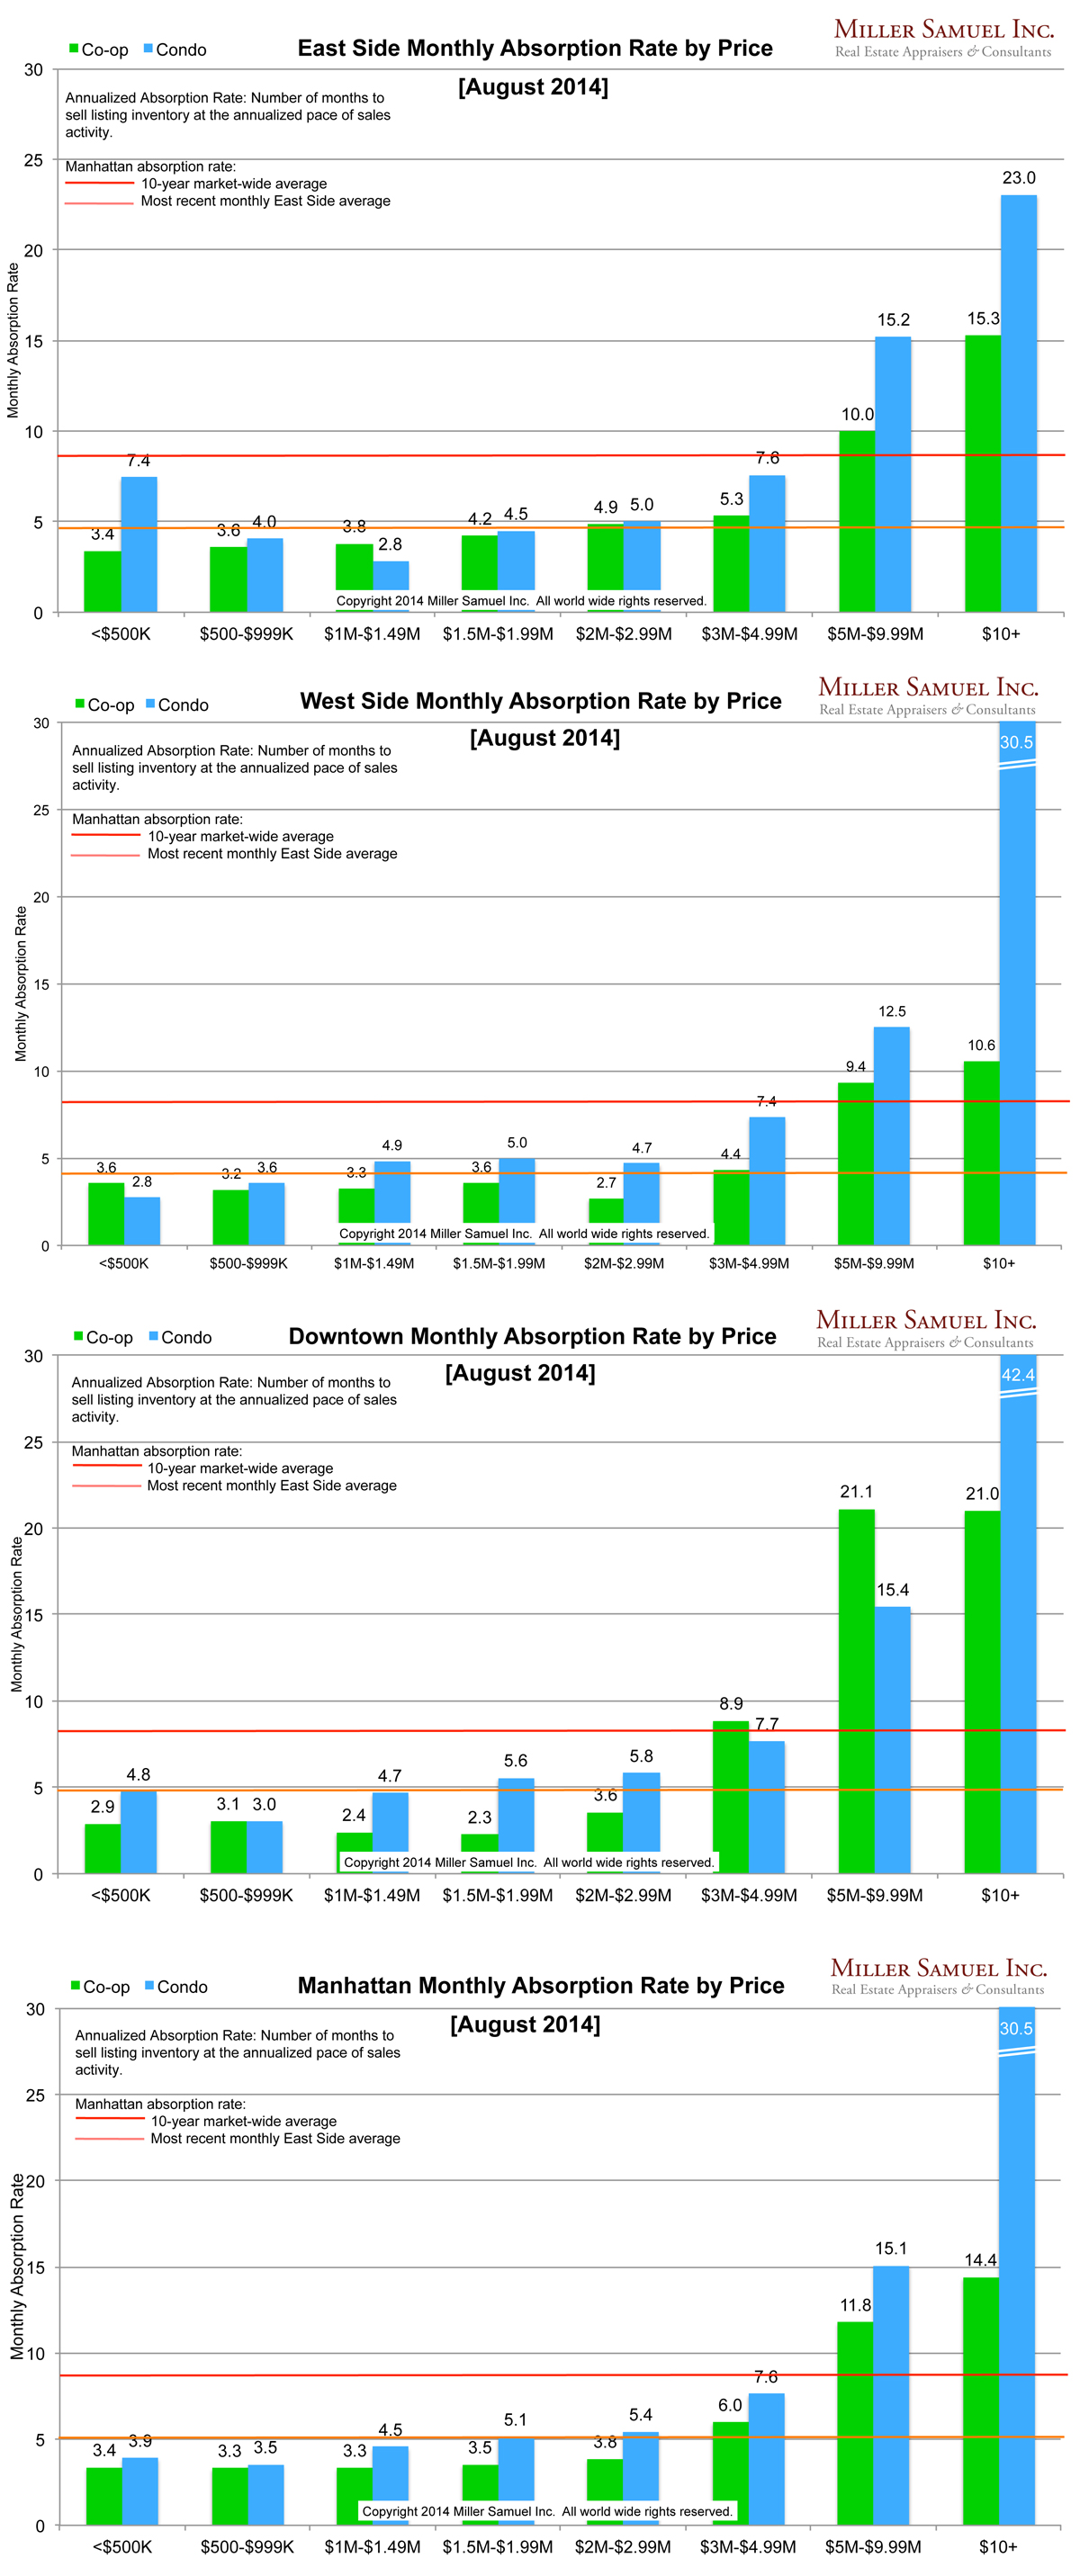
Thoughts The co-op and condo market absorption rates for the $10 million+ market have slowed over the past year while the pace of the sub-$3 million remains extremely brisk. The $3 million to $10 million shows limited change and some stabilization.
Side by side Manhattan regional comparison:
 [click images to expand]
I started this analysis in August 2009 so I am able to show side-by side year-over-year comparisons. (I got tired of the red/gray look in 2014 so I changed it) The blue/red line shows the 10-year quarterly average for context. The pink/orange line represents the overall average absorption rate of the most recently completed month for that market area.
Definition
Absorption defined for the purposes of this chart is: Number of months to sell all listing inventory at the current annualized pace of sales activity in our market report series.
_______________________
Manhattan Market Absorption Charts [Miller Samuel]