 [click to open report]
>“While we continue to see broad improvement in home prices as measured by the annual rate, the latest data show a far more mixed picture when you look at other details.” says David M. Blitzer, Chairman of the Index Committee at Standard & Poor’s.
Good news, bad news = mixed message
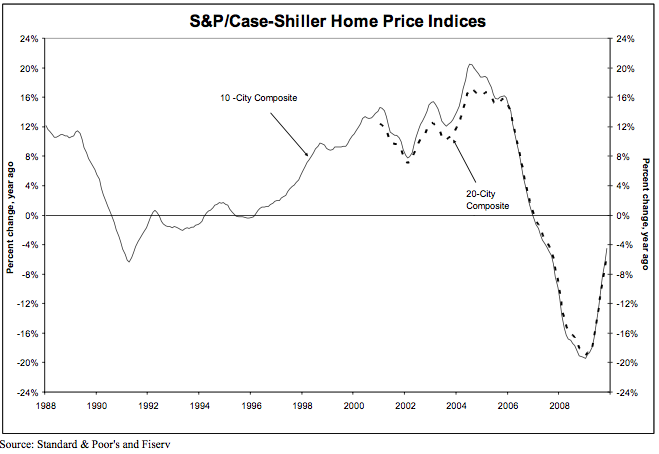
* 10 months of improved readings in the annual statistics, beginning in early 2009
* third consecutive month these statistics have registered single digit declines, after 20 consecutive months of double digit declines.
>“While we continue to see broad improvement in home prices as measured by the annual rate, the latest data show a far more mixed picture when you look at other details.”
* Four of the markets – Charlotte, Las Vegas, Seattle and Tampa – posted new low index levels as measured by the past four years.
* Only five of the markets saw price increases in November versus October.
The report also shows that prices are equivalent to late 2003.
What I didn’t understand was the following:
>We are in a seasonally weak period for home prices, so the seasonally- adjusted data are generally more positive, with 14 of the markets and both composites showing improved prices in November.
This sounds to me like the seasonal adjustments are skewing the data more positively than it should?
When I read the report, it seems like the message is no more mixed than it was in the prior 2 months. With rising foreclosures expected in 2010, perhaps the report commentary is banking on a more significant impact later this year but the data doesn’t yet show it.