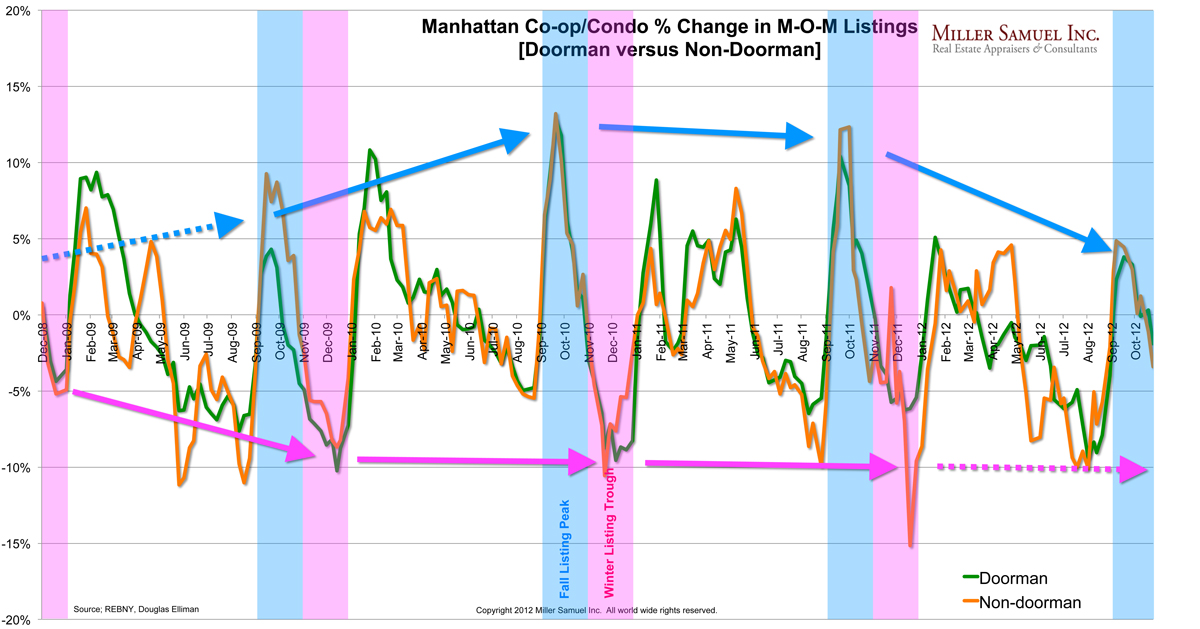
It’s time to share my Three Cents Worth (3CW) on Curbed NY, at the intersection of neighborhood and real estate in the capital of the world…and I’m here to take measurements.
Read this week’s 3CW column on @CurbedNY:
I started off trending the month-over-month percentage change in doorman (green line) and non-doorman (orange line) listings and they showed a very similar pattern [yawn] so I left the lines alone and looked at the larger pattern of peaks and troughs in listing activity at the end of the year. I’ve been tracking listing trends for more than a decade on a quarterly basis but only on a monthly basis since 2008 so I can’t go back pre-Lehman. I am especially interested in each fall market’s second sales hump (spring is hump number one) of the annual two-hump sales camel that occurs before the Thanksgiving holiday…
__________________________
Today’s Post: Manhattan’s Thanksgiving Listing Spread [Curbed]
Three Cents Worth Archive Curbed NY
Three Cents Worth Archive Curbed DC
Three Cents Worth Archive Curbed Miami


